Immigrants from Western Europe vs Immigrants from Sweden Wage/Income Gap
COMPARE
Immigrants from Western Europe
Immigrants from Sweden
Wage/Income Gap
Wage/Income Gap Comparison
Immigrants from Western Europe
Immigrants from Sweden
27.8%
WAGE/INCOME GAP
0.9/ 100
METRIC RATING
270th/ 347
METRIC RANK
28.1%
WAGE/INCOME GAP
0.4/ 100
METRIC RATING
284th/ 347
METRIC RANK
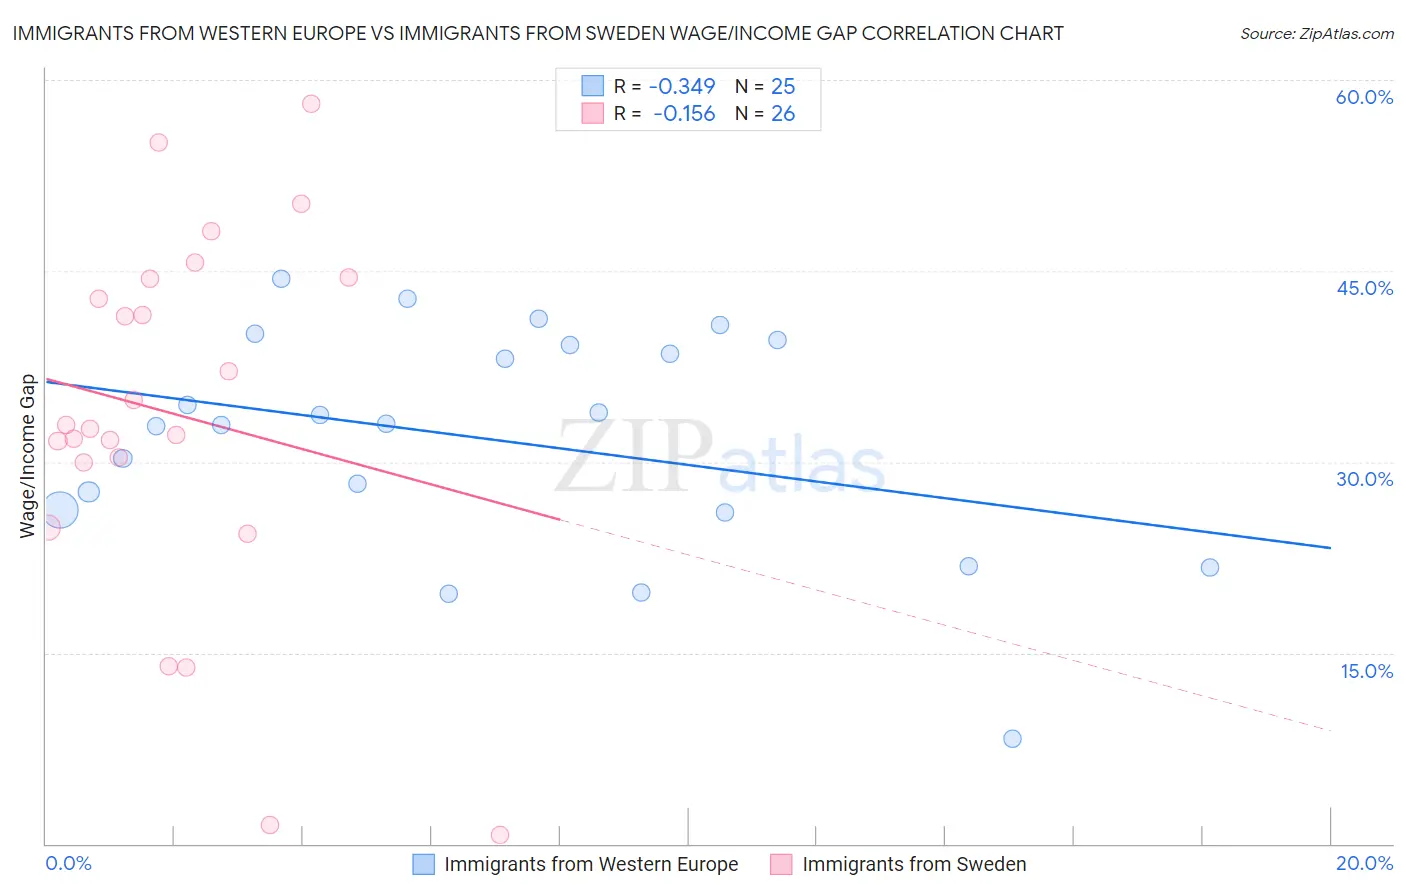
Immigrants from Western Europe vs Immigrants from Sweden Wage/Income Gap Correlation Chart
The statistical analysis conducted on geographies consisting of 493,207,642 people shows a mild negative correlation between the proportion of Immigrants from Western Europe and wage/income gap percentage in the United States with a correlation coefficient (R) of -0.349 and weighted average of 27.8%. Similarly, the statistical analysis conducted on geographies consisting of 164,690,992 people shows a poor negative correlation between the proportion of Immigrants from Sweden and wage/income gap percentage in the United States with a correlation coefficient (R) of -0.156 and weighted average of 28.1%, a difference of 1.1%.
Wage/Income Gap Correlation Summary
| Measurement | Immigrants from Western Europe | Immigrants from Sweden |
| Minimum | 8.2% | 0.69% |
| Maximum | 44.3% | 58.2% |
| Range | 36.1% | 57.5% |
| Mean | 31.8% | 33.7% |
| Median | 33.0% | 32.8% |
| Interquartile 25% (IQ1) | 26.1% | 30.0% |
| Interquartile 75% (IQ3) | 39.4% | 44.4% |
| Interquartile Range (IQR) | 13.2% | 14.4% |
| Standard Deviation (Sample) | 8.8% | 14.5% |
| Standard Deviation (Population) | 8.7% | 14.2% |
Demographics Similar to Immigrants from Western Europe and Immigrants from Sweden by Wage/Income Gap
In terms of wage/income gap, the demographic groups most similar to Immigrants from Western Europe are Ute (27.8%, a difference of 0.080%), Potawatomi (27.7%, a difference of 0.12%), New Zealander (27.7%, a difference of 0.13%), Immigrants from Korea (27.8%, a difference of 0.15%), and Turkish (27.7%, a difference of 0.21%). Similarly, the demographic groups most similar to Immigrants from Sweden are French Canadian (28.1%, a difference of 0.010%), Italian (28.1%, a difference of 0.13%), Immigrants from Austria (28.1%, a difference of 0.16%), South African (28.0%, a difference of 0.18%), and Okinawan (28.1%, a difference of 0.19%).
| Demographics | Rating | Rank | Wage/Income Gap |
| Turks | 1.0 /100 | #267 | Tragic 27.7% |
| New Zealanders | 1.0 /100 | #268 | Tragic 27.7% |
| Potawatomi | 0.9 /100 | #269 | Tragic 27.7% |
| Immigrants | Western Europe | 0.9 /100 | #270 | Tragic 27.8% |
| Ute | 0.8 /100 | #271 | Tragic 27.8% |
| Immigrants | Korea | 0.8 /100 | #272 | Tragic 27.8% |
| Bulgarians | 0.7 /100 | #273 | Tragic 27.8% |
| Americans | 0.7 /100 | #274 | Tragic 27.8% |
| Immigrants | Japan | 0.7 /100 | #275 | Tragic 27.9% |
| Lebanese | 0.7 /100 | #276 | Tragic 27.9% |
| Latvians | 0.7 /100 | #277 | Tragic 27.9% |
| Immigrants | England | 0.6 /100 | #278 | Tragic 27.9% |
| Romanians | 0.5 /100 | #279 | Tragic 28.0% |
| Russians | 0.5 /100 | #280 | Tragic 28.0% |
| Burmese | 0.5 /100 | #281 | Tragic 28.0% |
| South Africans | 0.5 /100 | #282 | Tragic 28.0% |
| French Canadians | 0.4 /100 | #283 | Tragic 28.1% |
| Immigrants | Sweden | 0.4 /100 | #284 | Tragic 28.1% |
| Italians | 0.4 /100 | #285 | Tragic 28.1% |
| Immigrants | Austria | 0.4 /100 | #286 | Tragic 28.1% |
| Okinawans | 0.4 /100 | #287 | Tragic 28.1% |