Immigrants from Belize vs Uruguayan Wage/Income Gap
COMPARE
Immigrants from Belize
Uruguayan
Wage/Income Gap
Wage/Income Gap Comparison
Immigrants from Belize
Uruguayans
21.3%
WAGE/INCOME GAP
100.0/ 100
METRIC RATING
38th/ 347
METRIC RANK
25.2%
WAGE/INCOME GAP
81.3/ 100
METRIC RATING
152nd/ 347
METRIC RANK
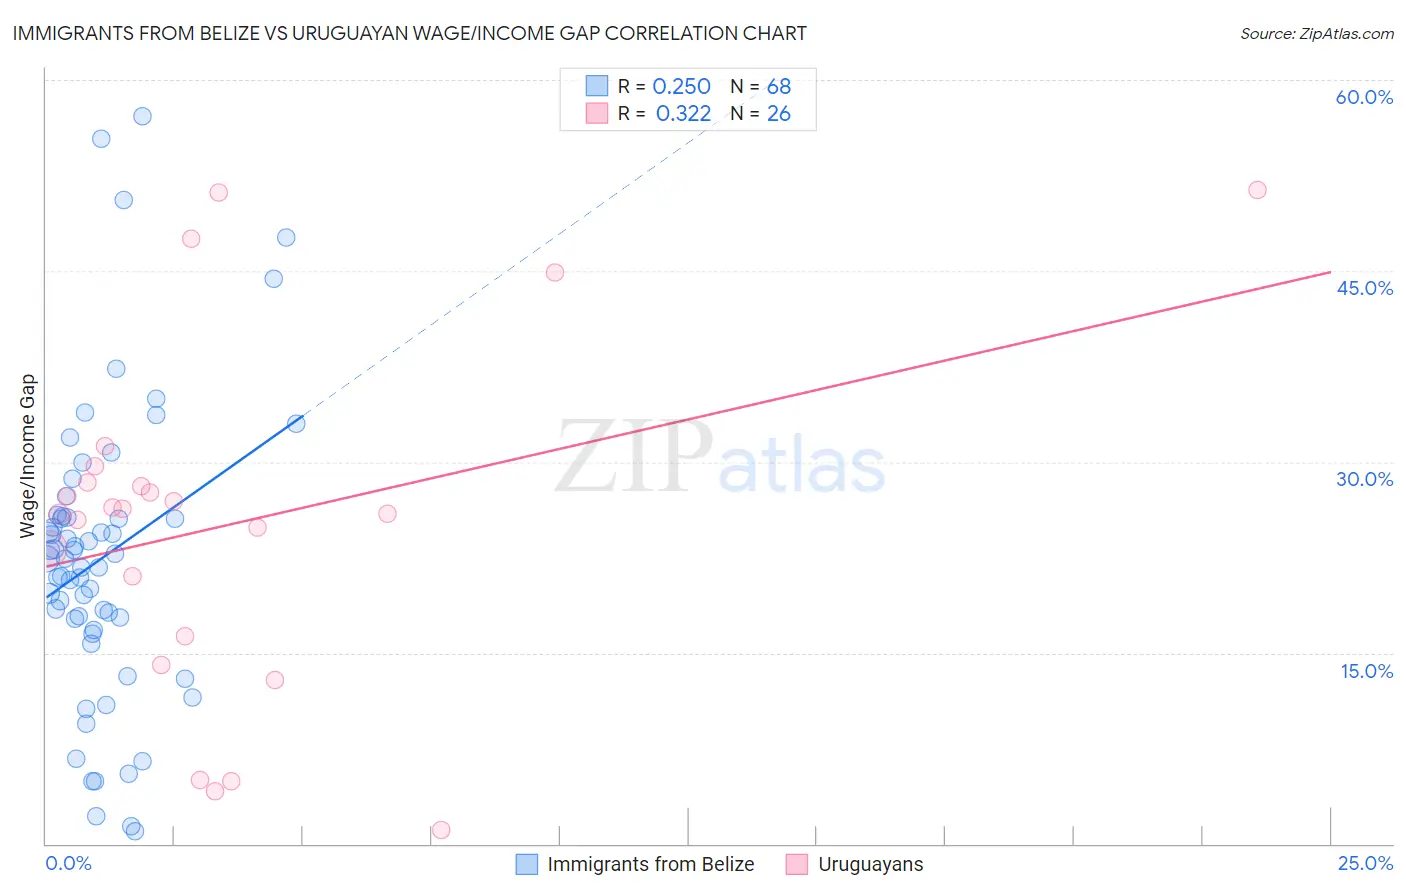
Immigrants from Belize vs Uruguayan Wage/Income Gap Correlation Chart
The statistical analysis conducted on geographies consisting of 130,310,260 people shows a weak positive correlation between the proportion of Immigrants from Belize and wage/income gap percentage in the United States with a correlation coefficient (R) of 0.250 and weighted average of 21.3%. Similarly, the statistical analysis conducted on geographies consisting of 144,770,221 people shows a mild positive correlation between the proportion of Uruguayans and wage/income gap percentage in the United States with a correlation coefficient (R) of 0.322 and weighted average of 25.2%, a difference of 18.3%.
Wage/Income Gap Correlation Summary
| Measurement | Immigrants from Belize | Uruguayan |
| Minimum | 0.94% | 1.1% |
| Maximum | 57.2% | 51.4% |
| Range | 56.2% | 50.3% |
| Mean | 22.4% | 25.1% |
| Median | 22.4% | 26.1% |
| Interquartile 25% (IQ1) | 17.3% | 16.3% |
| Interquartile 75% (IQ3) | 25.7% | 28.4% |
| Interquartile Range (IQR) | 8.4% | 12.1% |
| Standard Deviation (Sample) | 11.6% | 13.5% |
| Standard Deviation (Population) | 11.5% | 13.2% |
Similar Demographics by Wage/Income Gap
Demographics Similar to Immigrants from Belize by Wage/Income Gap
In terms of wage/income gap, the demographic groups most similar to Immigrants from Belize are Immigrants from Somalia (21.2%, a difference of 0.050%), Colville (21.3%, a difference of 0.11%), Belizean (21.2%, a difference of 0.12%), Somali (21.2%, a difference of 0.14%), and Lumbee (21.3%, a difference of 0.31%).
| Demographics | Rating | Rank | Wage/Income Gap |
| Vietnamese | 100.0 /100 | #31 | Exceptional 21.0% |
| Immigrants | Yemen | 100.0 /100 | #32 | Exceptional 21.1% |
| Immigrants | Bahamas | 100.0 /100 | #33 | Exceptional 21.1% |
| Pima | 100.0 /100 | #34 | Exceptional 21.1% |
| Somalis | 100.0 /100 | #35 | Exceptional 21.2% |
| Belizeans | 100.0 /100 | #36 | Exceptional 21.2% |
| Immigrants | Somalia | 100.0 /100 | #37 | Exceptional 21.2% |
| Immigrants | Belize | 100.0 /100 | #38 | Exceptional 21.3% |
| Colville | 100.0 /100 | #39 | Exceptional 21.3% |
| Lumbee | 100.0 /100 | #40 | Exceptional 21.3% |
| Liberians | 100.0 /100 | #41 | Exceptional 21.4% |
| Immigrants | Sierra Leone | 100.0 /100 | #42 | Exceptional 21.4% |
| Sierra Leoneans | 100.0 /100 | #43 | Exceptional 21.4% |
| Immigrants | Eritrea | 100.0 /100 | #44 | Exceptional 21.4% |
| U.S. Virgin Islanders | 100.0 /100 | #45 | Exceptional 21.5% |
Demographics Similar to Uruguayans by Wage/Income Gap
In terms of wage/income gap, the demographic groups most similar to Uruguayans are Taiwanese (25.1%, a difference of 0.030%), Immigrants (25.1%, a difference of 0.11%), Immigrants from Peru (25.1%, a difference of 0.16%), Iroquois (25.1%, a difference of 0.30%), and Blackfeet (25.2%, a difference of 0.32%).
| Demographics | Rating | Rank | Wage/Income Gap |
| Comanche | 85.2 /100 | #145 | Excellent 25.0% |
| South Americans | 85.2 /100 | #146 | Excellent 25.0% |
| Malaysians | 84.9 /100 | #147 | Excellent 25.0% |
| Iroquois | 83.9 /100 | #148 | Excellent 25.1% |
| Immigrants | Peru | 82.6 /100 | #149 | Excellent 25.1% |
| Immigrants | Immigrants | 82.3 /100 | #150 | Excellent 25.1% |
| Taiwanese | 81.6 /100 | #151 | Excellent 25.1% |
| Uruguayans | 81.3 /100 | #152 | Excellent 25.2% |
| Blackfeet | 78.1 /100 | #153 | Good 25.2% |
| Immigrants | Northern Africa | 78.1 /100 | #154 | Good 25.2% |
| Immigrants | Vietnam | 77.7 /100 | #155 | Good 25.2% |
| Immigrants | Mexico | 76.4 /100 | #156 | Good 25.3% |
| Costa Ricans | 75.8 /100 | #157 | Good 25.3% |
| Immigrants | Zimbabwe | 73.7 /100 | #158 | Good 25.3% |
| Puget Sound Salish | 73.0 /100 | #159 | Good 25.3% |