Cambodian vs Immigrants from Sweden Wage/Income Gap
COMPARE
Cambodian
Immigrants from Sweden
Wage/Income Gap
Wage/Income Gap Comparison
Cambodians
Immigrants from Sweden
25.8%
WAGE/INCOME GAP
45.1/ 100
METRIC RATING
177th/ 347
METRIC RANK
28.1%
WAGE/INCOME GAP
0.4/ 100
METRIC RATING
284th/ 347
METRIC RANK
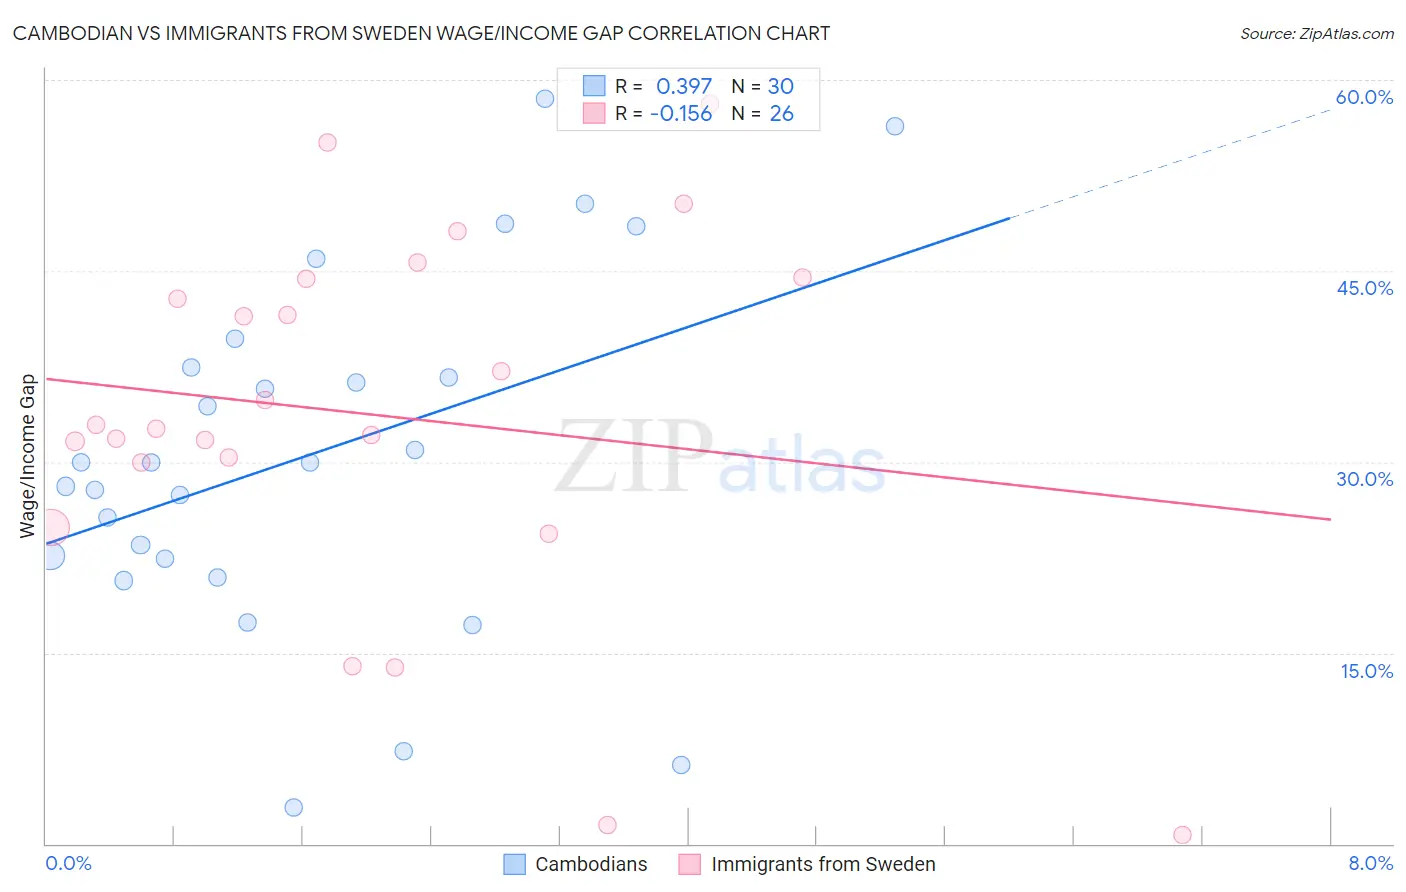
Cambodian vs Immigrants from Sweden Wage/Income Gap Correlation Chart
The statistical analysis conducted on geographies consisting of 102,500,825 people shows a mild positive correlation between the proportion of Cambodians and wage/income gap percentage in the United States with a correlation coefficient (R) of 0.397 and weighted average of 25.8%. Similarly, the statistical analysis conducted on geographies consisting of 164,690,992 people shows a poor negative correlation between the proportion of Immigrants from Sweden and wage/income gap percentage in the United States with a correlation coefficient (R) of -0.156 and weighted average of 28.1%, a difference of 8.6%.
Wage/Income Gap Correlation Summary
| Measurement | Cambodian | Immigrants from Sweden |
| Minimum | 2.9% | 0.69% |
| Maximum | 58.5% | 58.2% |
| Range | 55.6% | 57.5% |
| Mean | 30.6% | 33.7% |
| Median | 29.9% | 32.8% |
| Interquartile 25% (IQ1) | 22.4% | 30.0% |
| Interquartile 75% (IQ3) | 37.4% | 44.4% |
| Interquartile Range (IQR) | 15.0% | 14.4% |
| Standard Deviation (Sample) | 13.9% | 14.5% |
| Standard Deviation (Population) | 13.7% | 14.2% |
Similar Demographics by Wage/Income Gap
Demographics Similar to Cambodians by Wage/Income Gap
In terms of wage/income gap, the demographic groups most similar to Cambodians are Paraguayan (25.8%, a difference of 0.11%), Sri Lankan (25.8%, a difference of 0.12%), Chinese (25.9%, a difference of 0.21%), Alaskan Athabascan (25.8%, a difference of 0.32%), and Samoan (26.0%, a difference of 0.44%).
| Demographics | Rating | Rank | Wage/Income Gap |
| Immigrants | Oceania | 57.5 /100 | #170 | Average 25.6% |
| Immigrants | Greece | 56.6 /100 | #171 | Average 25.7% |
| Immigrants | Chile | 53.2 /100 | #172 | Average 25.7% |
| Immigrants | Belarus | 52.9 /100 | #173 | Average 25.7% |
| Alaskan Athabascans | 50.0 /100 | #174 | Average 25.8% |
| Sri Lankans | 47.0 /100 | #175 | Average 25.8% |
| Paraguayans | 46.7 /100 | #176 | Average 25.8% |
| Cambodians | 45.1 /100 | #177 | Average 25.8% |
| Chinese | 42.0 /100 | #178 | Average 25.9% |
| Samoans | 38.6 /100 | #179 | Fair 26.0% |
| Guamanians/Chamorros | 38.0 /100 | #180 | Fair 26.0% |
| Immigrants | Bolivia | 36.4 /100 | #181 | Fair 26.0% |
| Immigrants | Serbia | 35.4 /100 | #182 | Fair 26.0% |
| Immigrants | Kazakhstan | 35.2 /100 | #183 | Fair 26.0% |
| Mexicans | 34.4 /100 | #184 | Fair 26.0% |
Demographics Similar to Immigrants from Sweden by Wage/Income Gap
In terms of wage/income gap, the demographic groups most similar to Immigrants from Sweden are French Canadian (28.1%, a difference of 0.010%), Italian (28.1%, a difference of 0.13%), Immigrants from Austria (28.1%, a difference of 0.16%), South African (28.0%, a difference of 0.18%), and Okinawan (28.1%, a difference of 0.19%).
| Demographics | Rating | Rank | Wage/Income Gap |
| Latvians | 0.7 /100 | #277 | Tragic 27.9% |
| Immigrants | England | 0.6 /100 | #278 | Tragic 27.9% |
| Romanians | 0.5 /100 | #279 | Tragic 28.0% |
| Russians | 0.5 /100 | #280 | Tragic 28.0% |
| Burmese | 0.5 /100 | #281 | Tragic 28.0% |
| South Africans | 0.5 /100 | #282 | Tragic 28.0% |
| French Canadians | 0.4 /100 | #283 | Tragic 28.1% |
| Immigrants | Sweden | 0.4 /100 | #284 | Tragic 28.1% |
| Italians | 0.4 /100 | #285 | Tragic 28.1% |
| Immigrants | Austria | 0.4 /100 | #286 | Tragic 28.1% |
| Okinawans | 0.4 /100 | #287 | Tragic 28.1% |
| Choctaw | 0.4 /100 | #288 | Tragic 28.1% |
| Canadians | 0.3 /100 | #289 | Tragic 28.1% |
| Australians | 0.3 /100 | #290 | Tragic 28.2% |
| Czechoslovakians | 0.3 /100 | #291 | Tragic 28.2% |