Houma vs Immigrants from Zimbabwe Median Female Earnings
COMPARE
Houma
Immigrants from Zimbabwe
Median Female Earnings
Median Female Earnings Comparison
Houma
Immigrants from Zimbabwe
$30,343
MEDIAN FEMALE EARNINGS
0.0/ 100
METRIC RATING
347th/ 347
METRIC RANK
$41,527
MEDIAN FEMALE EARNINGS
97.8/ 100
METRIC RATING
104th/ 347
METRIC RANK
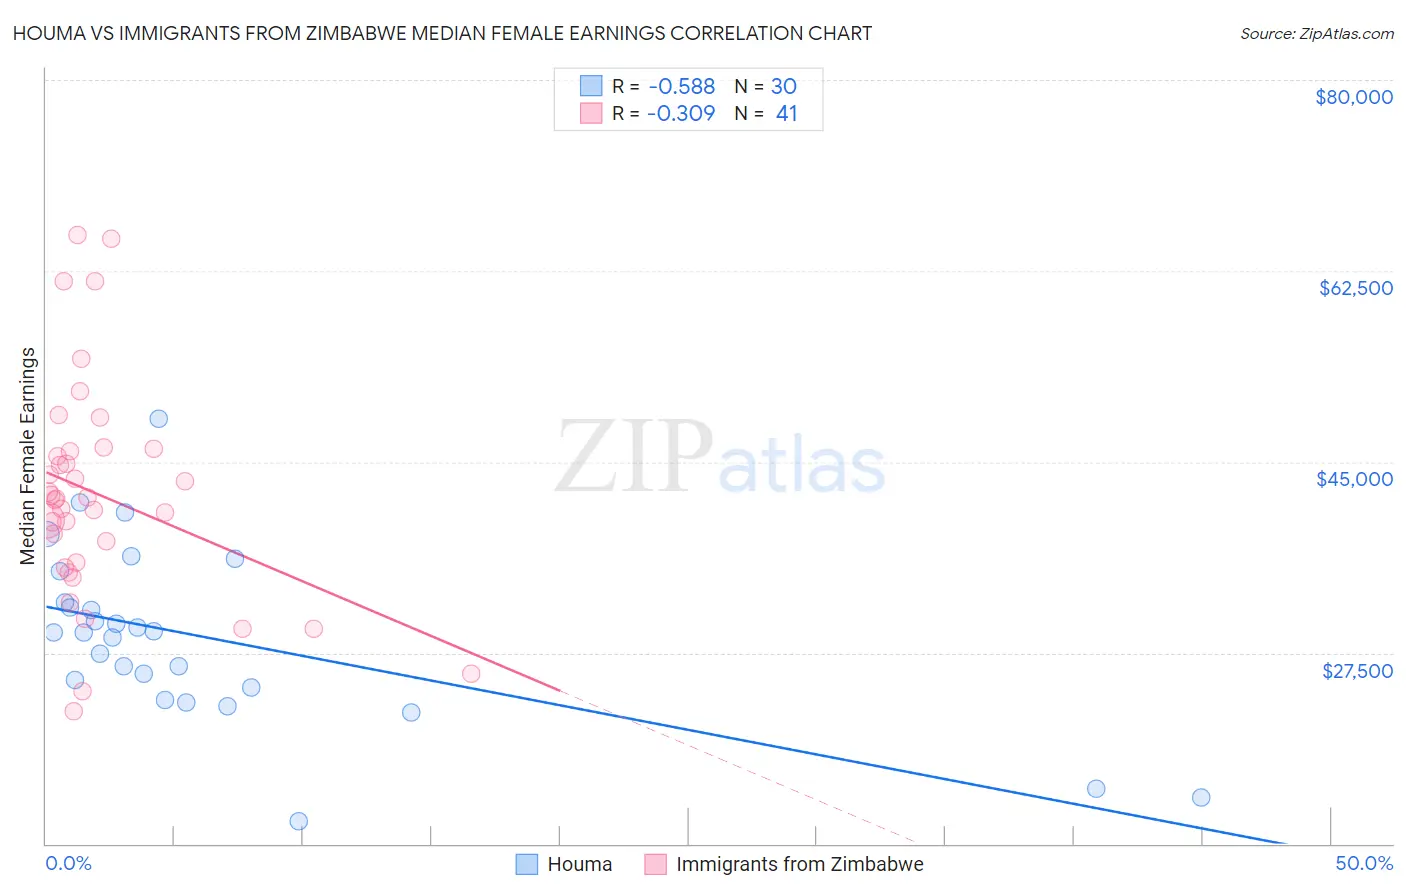
Houma vs Immigrants from Zimbabwe Median Female Earnings Correlation Chart
The statistical analysis conducted on geographies consisting of 36,795,297 people shows a substantial negative correlation between the proportion of Houma and median female earnings in the United States with a correlation coefficient (R) of -0.588 and weighted average of $30,343. Similarly, the statistical analysis conducted on geographies consisting of 117,801,183 people shows a mild negative correlation between the proportion of Immigrants from Zimbabwe and median female earnings in the United States with a correlation coefficient (R) of -0.309 and weighted average of $41,527, a difference of 36.9%.
Median Female Earnings Correlation Summary
| Measurement | Houma | Immigrants from Zimbabwe |
| Minimum | $12,038 | $22,161 |
| Maximum | $48,900 | $65,750 |
| Range | $36,862 | $43,589 |
| Mean | $28,868 | $42,000 |
| Median | $29,403 | $41,577 |
| Interquartile 25% (IQ1) | $24,292 | $35,499 |
| Interquartile 75% (IQ3) | $32,114 | $46,072 |
| Interquartile Range (IQR) | $7,822 | $10,573 |
| Standard Deviation (Sample) | $8,016 | $10,097 |
| Standard Deviation (Population) | $7,881 | $9,973 |
Similar Demographics by Median Female Earnings
Demographics Similar to Houma by Median Female Earnings
In terms of median female earnings, the demographic groups most similar to Houma are Arapaho ($31,489, a difference of 3.8%), Puerto Rican ($31,560, a difference of 4.0%), Lumbee ($32,500, a difference of 7.1%), Pueblo ($32,564, a difference of 7.3%), and Yup'ik ($32,730, a difference of 7.9%).
| Demographics | Rating | Rank | Median Female Earnings |
| Mexicans | 0.0 /100 | #333 | Tragic $33,664 |
| Spanish American Indians | 0.0 /100 | #334 | Tragic $33,625 |
| Creek | 0.0 /100 | #335 | Tragic $33,437 |
| Ottawa | 0.0 /100 | #336 | Tragic $33,378 |
| Yakama | 0.0 /100 | #337 | Tragic $33,354 |
| Immigrants | Cuba | 0.0 /100 | #338 | Tragic $33,291 |
| Immigrants | Mexico | 0.0 /100 | #339 | Tragic $33,236 |
| Tohono O'odham | 0.0 /100 | #340 | Tragic $33,205 |
| Navajo | 0.0 /100 | #341 | Tragic $33,046 |
| Yup'ik | 0.0 /100 | #342 | Tragic $32,730 |
| Pueblo | 0.0 /100 | #343 | Tragic $32,564 |
| Lumbee | 0.0 /100 | #344 | Tragic $32,500 |
| Puerto Ricans | 0.0 /100 | #345 | Tragic $31,560 |
| Arapaho | 0.0 /100 | #346 | Tragic $31,489 |
| Houma | 0.0 /100 | #347 | Tragic $30,343 |
Demographics Similar to Immigrants from Zimbabwe by Median Female Earnings
In terms of median female earnings, the demographic groups most similar to Immigrants from Zimbabwe are Italian ($41,505, a difference of 0.050%), Immigrants from Argentina ($41,554, a difference of 0.060%), Immigrants from Eritrea ($41,485, a difference of 0.10%), Palestinian ($41,484, a difference of 0.10%), and Jordanian ($41,464, a difference of 0.15%).
| Demographics | Rating | Rank | Median Female Earnings |
| Immigrants | Hungary | 98.8 /100 | #97 | Exceptional $41,820 |
| Immigrants | Scotland | 98.7 /100 | #98 | Exceptional $41,771 |
| Immigrants | Barbados | 98.4 /100 | #99 | Exceptional $41,685 |
| Romanians | 98.3 /100 | #100 | Exceptional $41,663 |
| Immigrants | Fiji | 98.3 /100 | #101 | Exceptional $41,656 |
| Immigrants | Poland | 98.2 /100 | #102 | Exceptional $41,630 |
| Immigrants | Argentina | 97.9 /100 | #103 | Exceptional $41,554 |
| Immigrants | Zimbabwe | 97.8 /100 | #104 | Exceptional $41,527 |
| Italians | 97.7 /100 | #105 | Exceptional $41,505 |
| Immigrants | Eritrea | 97.6 /100 | #106 | Exceptional $41,485 |
| Palestinians | 97.6 /100 | #107 | Exceptional $41,484 |
| Jordanians | 97.5 /100 | #108 | Exceptional $41,464 |
| Chinese | 97.5 /100 | #109 | Exceptional $41,461 |
| Immigrants | Western Asia | 97.0 /100 | #110 | Exceptional $41,375 |
| Immigrants | Canada | 97.0 /100 | #111 | Exceptional $41,373 |