Hawaiian vs Immigrants from Zimbabwe Median Female Earnings
COMPARE
Hawaiian
Immigrants from Zimbabwe
Median Female Earnings
Median Female Earnings Comparison
Hawaiians
Immigrants from Zimbabwe
$37,497
MEDIAN FEMALE EARNINGS
1.0/ 100
METRIC RATING
257th/ 347
METRIC RANK
$41,527
MEDIAN FEMALE EARNINGS
97.8/ 100
METRIC RATING
104th/ 347
METRIC RANK
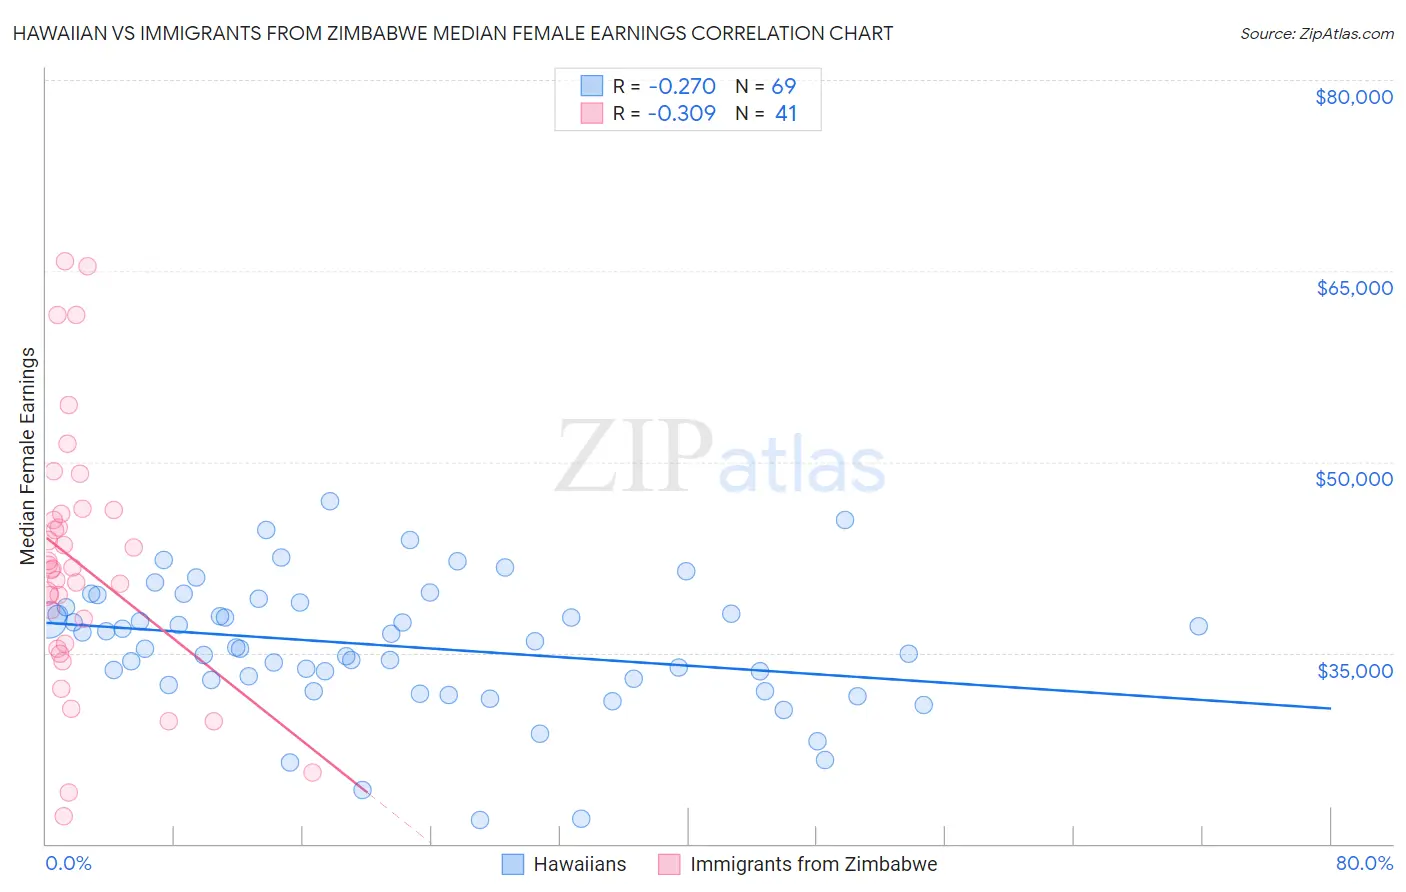
Hawaiian vs Immigrants from Zimbabwe Median Female Earnings Correlation Chart
The statistical analysis conducted on geographies consisting of 327,459,895 people shows a weak negative correlation between the proportion of Hawaiians and median female earnings in the United States with a correlation coefficient (R) of -0.270 and weighted average of $37,497. Similarly, the statistical analysis conducted on geographies consisting of 117,801,183 people shows a mild negative correlation between the proportion of Immigrants from Zimbabwe and median female earnings in the United States with a correlation coefficient (R) of -0.309 and weighted average of $41,527, a difference of 10.7%.
Median Female Earnings Correlation Summary
| Measurement | Hawaiian | Immigrants from Zimbabwe |
| Minimum | $21,870 | $22,161 |
| Maximum | $46,893 | $65,750 |
| Range | $25,022 | $43,589 |
| Mean | $35,548 | $42,000 |
| Median | $35,373 | $41,577 |
| Interquartile 25% (IQ1) | $32,654 | $35,499 |
| Interquartile 75% (IQ3) | $38,788 | $46,072 |
| Interquartile Range (IQR) | $6,134 | $10,573 |
| Standard Deviation (Sample) | $5,103 | $10,097 |
| Standard Deviation (Population) | $5,066 | $9,973 |
Similar Demographics by Median Female Earnings
Demographics Similar to Hawaiians by Median Female Earnings
In terms of median female earnings, the demographic groups most similar to Hawaiians are Samoan ($37,498, a difference of 0.0%), Colville ($37,514, a difference of 0.040%), White/Caucasian ($37,531, a difference of 0.090%), Belizean ($37,429, a difference of 0.18%), and Scotch-Irish ($37,383, a difference of 0.31%).
| Demographics | Rating | Rank | Median Female Earnings |
| Immigrants | Iraq | 2.2 /100 | #250 | Tragic $37,864 |
| Welsh | 2.1 /100 | #251 | Tragic $37,856 |
| Immigrants | Dominica | 2.0 /100 | #252 | Tragic $37,825 |
| Danes | 1.6 /100 | #253 | Tragic $37,730 |
| Whites/Caucasians | 1.1 /100 | #254 | Tragic $37,531 |
| Colville | 1.1 /100 | #255 | Tragic $37,514 |
| Samoans | 1.0 /100 | #256 | Tragic $37,498 |
| Hawaiians | 1.0 /100 | #257 | Tragic $37,497 |
| Belizeans | 0.9 /100 | #258 | Tragic $37,429 |
| Scotch-Irish | 0.8 /100 | #259 | Tragic $37,383 |
| Dutch | 0.7 /100 | #260 | Tragic $37,339 |
| Malaysians | 0.7 /100 | #261 | Tragic $37,298 |
| Venezuelans | 0.7 /100 | #262 | Tragic $37,282 |
| German Russians | 0.5 /100 | #263 | Tragic $37,105 |
| Salvadorans | 0.4 /100 | #264 | Tragic $37,083 |
Demographics Similar to Immigrants from Zimbabwe by Median Female Earnings
In terms of median female earnings, the demographic groups most similar to Immigrants from Zimbabwe are Italian ($41,505, a difference of 0.050%), Immigrants from Argentina ($41,554, a difference of 0.060%), Immigrants from Eritrea ($41,485, a difference of 0.10%), Palestinian ($41,484, a difference of 0.10%), and Jordanian ($41,464, a difference of 0.15%).
| Demographics | Rating | Rank | Median Female Earnings |
| Immigrants | Hungary | 98.8 /100 | #97 | Exceptional $41,820 |
| Immigrants | Scotland | 98.7 /100 | #98 | Exceptional $41,771 |
| Immigrants | Barbados | 98.4 /100 | #99 | Exceptional $41,685 |
| Romanians | 98.3 /100 | #100 | Exceptional $41,663 |
| Immigrants | Fiji | 98.3 /100 | #101 | Exceptional $41,656 |
| Immigrants | Poland | 98.2 /100 | #102 | Exceptional $41,630 |
| Immigrants | Argentina | 97.9 /100 | #103 | Exceptional $41,554 |
| Immigrants | Zimbabwe | 97.8 /100 | #104 | Exceptional $41,527 |
| Italians | 97.7 /100 | #105 | Exceptional $41,505 |
| Immigrants | Eritrea | 97.6 /100 | #106 | Exceptional $41,485 |
| Palestinians | 97.6 /100 | #107 | Exceptional $41,484 |
| Jordanians | 97.5 /100 | #108 | Exceptional $41,464 |
| Chinese | 97.5 /100 | #109 | Exceptional $41,461 |
| Immigrants | Western Asia | 97.0 /100 | #110 | Exceptional $41,375 |
| Immigrants | Canada | 97.0 /100 | #111 | Exceptional $41,373 |