Houma vs Estonian Median Female Earnings
COMPARE
Houma
Estonian
Median Female Earnings
Median Female Earnings Comparison
Houma
Estonians
$30,343
MEDIAN FEMALE EARNINGS
0.0/ 100
METRIC RATING
347th/ 347
METRIC RANK
$43,106
MEDIAN FEMALE EARNINGS
99.9/ 100
METRIC RATING
59th/ 347
METRIC RANK
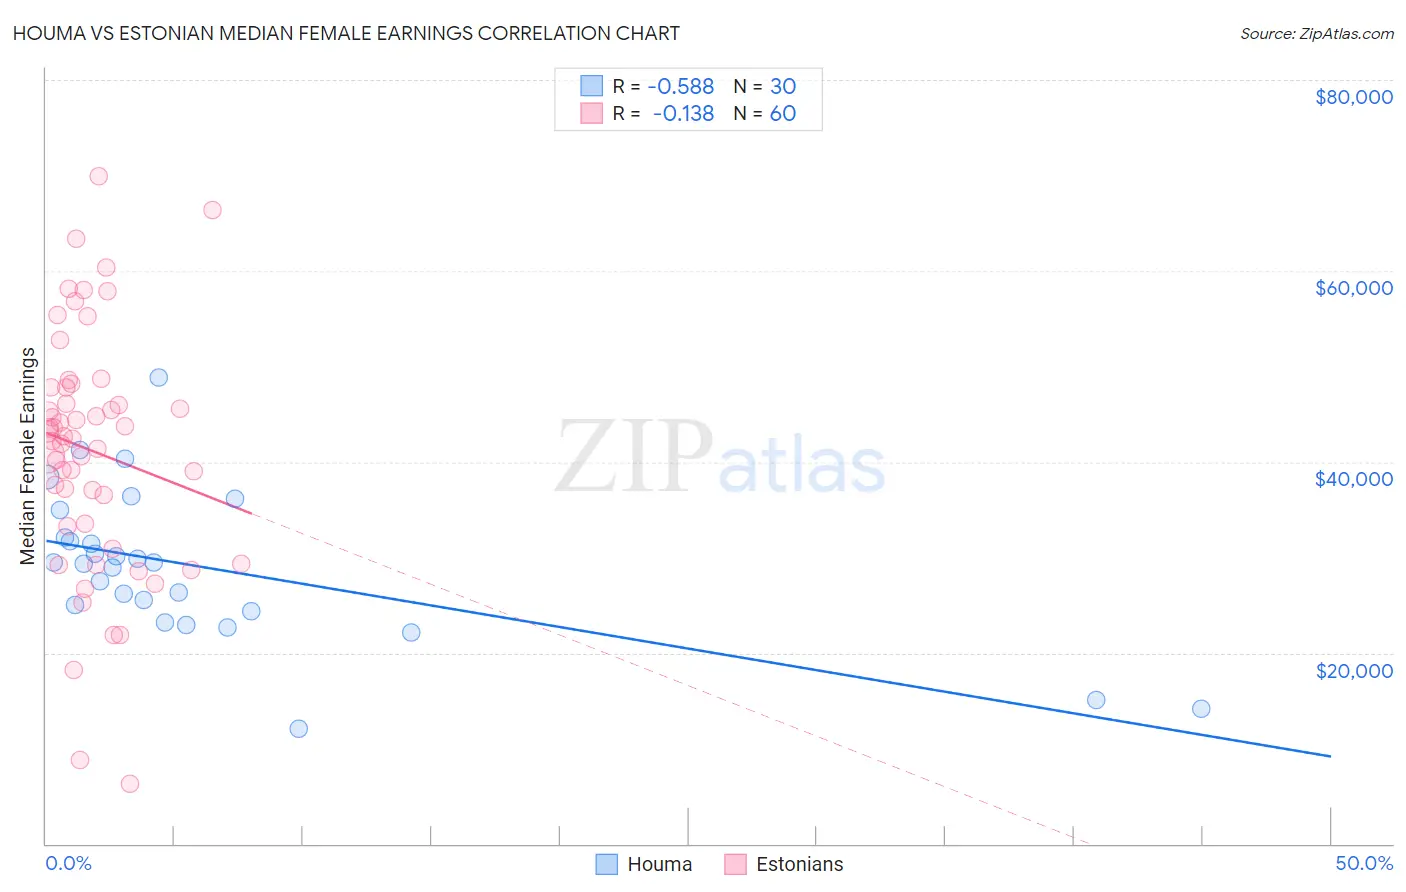
Houma vs Estonian Median Female Earnings Correlation Chart
The statistical analysis conducted on geographies consisting of 36,795,297 people shows a substantial negative correlation between the proportion of Houma and median female earnings in the United States with a correlation coefficient (R) of -0.588 and weighted average of $30,343. Similarly, the statistical analysis conducted on geographies consisting of 123,507,211 people shows a poor negative correlation between the proportion of Estonians and median female earnings in the United States with a correlation coefficient (R) of -0.138 and weighted average of $43,106, a difference of 42.1%.
Median Female Earnings Correlation Summary
| Measurement | Houma | Estonian |
| Minimum | $12,038 | $6,250 |
| Maximum | $48,900 | $69,908 |
| Range | $36,862 | $63,658 |
| Mean | $28,868 | $41,197 |
| Median | $29,403 | $42,543 |
| Interquartile 25% (IQ1) | $24,292 | $33,356 |
| Interquartile 75% (IQ3) | $32,114 | $47,750 |
| Interquartile Range (IQR) | $7,822 | $14,393 |
| Standard Deviation (Sample) | $8,016 | $12,774 |
| Standard Deviation (Population) | $7,881 | $12,667 |
Similar Demographics by Median Female Earnings
Demographics Similar to Houma by Median Female Earnings
In terms of median female earnings, the demographic groups most similar to Houma are Arapaho ($31,489, a difference of 3.8%), Puerto Rican ($31,560, a difference of 4.0%), Lumbee ($32,500, a difference of 7.1%), Pueblo ($32,564, a difference of 7.3%), and Yup'ik ($32,730, a difference of 7.9%).
| Demographics | Rating | Rank | Median Female Earnings |
| Mexicans | 0.0 /100 | #333 | Tragic $33,664 |
| Spanish American Indians | 0.0 /100 | #334 | Tragic $33,625 |
| Creek | 0.0 /100 | #335 | Tragic $33,437 |
| Ottawa | 0.0 /100 | #336 | Tragic $33,378 |
| Yakama | 0.0 /100 | #337 | Tragic $33,354 |
| Immigrants | Cuba | 0.0 /100 | #338 | Tragic $33,291 |
| Immigrants | Mexico | 0.0 /100 | #339 | Tragic $33,236 |
| Tohono O'odham | 0.0 /100 | #340 | Tragic $33,205 |
| Navajo | 0.0 /100 | #341 | Tragic $33,046 |
| Yup'ik | 0.0 /100 | #342 | Tragic $32,730 |
| Pueblo | 0.0 /100 | #343 | Tragic $32,564 |
| Lumbee | 0.0 /100 | #344 | Tragic $32,500 |
| Puerto Ricans | 0.0 /100 | #345 | Tragic $31,560 |
| Arapaho | 0.0 /100 | #346 | Tragic $31,489 |
| Houma | 0.0 /100 | #347 | Tragic $30,343 |
Demographics Similar to Estonians by Median Female Earnings
In terms of median female earnings, the demographic groups most similar to Estonians are Immigrants from Latvia ($43,099, a difference of 0.020%), Immigrants from Bulgaria ($43,085, a difference of 0.050%), Afghan ($43,077, a difference of 0.070%), Immigrants from Ukraine ($43,069, a difference of 0.090%), and Immigrants from Pakistan ($43,052, a difference of 0.12%).
| Demographics | Rating | Rank | Median Female Earnings |
| Immigrants | Lithuania | 99.9 /100 | #52 | Exceptional $43,317 |
| Immigrants | Eastern Europe | 99.9 /100 | #53 | Exceptional $43,309 |
| Australians | 99.9 /100 | #54 | Exceptional $43,308 |
| Egyptians | 99.9 /100 | #55 | Exceptional $43,305 |
| Immigrants | Croatia | 99.9 /100 | #56 | Exceptional $43,258 |
| Ethiopians | 99.9 /100 | #57 | Exceptional $43,243 |
| Paraguayans | 99.9 /100 | #58 | Exceptional $43,173 |
| Estonians | 99.9 /100 | #59 | Exceptional $43,106 |
| Immigrants | Latvia | 99.9 /100 | #60 | Exceptional $43,099 |
| Immigrants | Bulgaria | 99.9 /100 | #61 | Exceptional $43,085 |
| Afghans | 99.9 /100 | #62 | Exceptional $43,077 |
| Immigrants | Ukraine | 99.9 /100 | #63 | Exceptional $43,069 |
| Immigrants | Pakistan | 99.9 /100 | #64 | Exceptional $43,052 |
| Sierra Leoneans | 99.9 /100 | #65 | Exceptional $42,868 |
| Immigrants | Norway | 99.9 /100 | #66 | Exceptional $42,837 |