Houma vs Immigrants from Cabo Verde Median Female Earnings
COMPARE
Houma
Immigrants from Cabo Verde
Median Female Earnings
Median Female Earnings Comparison
Houma
Immigrants from Cabo Verde
$30,343
MEDIAN FEMALE EARNINGS
0.0/ 100
METRIC RATING
347th/ 347
METRIC RANK
$38,208
MEDIAN FEMALE EARNINGS
4.3/ 100
METRIC RATING
237th/ 347
METRIC RANK
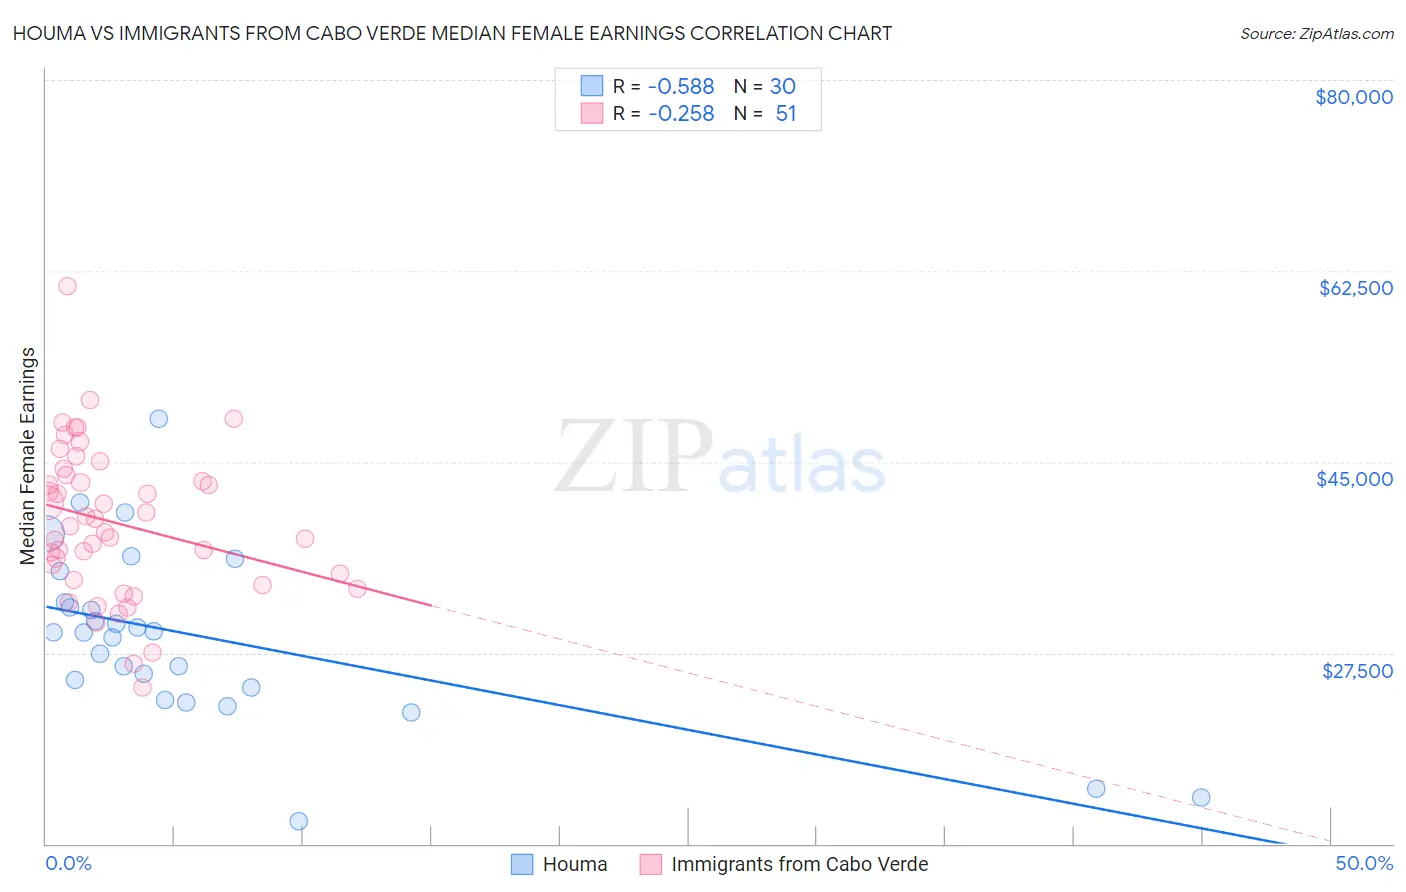
Houma vs Immigrants from Cabo Verde Median Female Earnings Correlation Chart
The statistical analysis conducted on geographies consisting of 36,795,297 people shows a substantial negative correlation between the proportion of Houma and median female earnings in the United States with a correlation coefficient (R) of -0.588 and weighted average of $30,343. Similarly, the statistical analysis conducted on geographies consisting of 38,158,316 people shows a weak negative correlation between the proportion of Immigrants from Cabo Verde and median female earnings in the United States with a correlation coefficient (R) of -0.258 and weighted average of $38,208, a difference of 25.9%.
Median Female Earnings Correlation Summary
| Measurement | Houma | Immigrants from Cabo Verde |
| Minimum | $12,038 | $24,340 |
| Maximum | $48,900 | $61,096 |
| Range | $36,862 | $36,756 |
| Mean | $28,868 | $39,427 |
| Median | $29,403 | $39,071 |
| Interquartile 25% (IQ1) | $24,292 | $34,187 |
| Interquartile 75% (IQ3) | $32,114 | $43,779 |
| Interquartile Range (IQR) | $7,822 | $9,592 |
| Standard Deviation (Sample) | $8,016 | $6,953 |
| Standard Deviation (Population) | $7,881 | $6,885 |
Similar Demographics by Median Female Earnings
Demographics Similar to Houma by Median Female Earnings
In terms of median female earnings, the demographic groups most similar to Houma are Arapaho ($31,489, a difference of 3.8%), Puerto Rican ($31,560, a difference of 4.0%), Lumbee ($32,500, a difference of 7.1%), Pueblo ($32,564, a difference of 7.3%), and Yup'ik ($32,730, a difference of 7.9%).
| Demographics | Rating | Rank | Median Female Earnings |
| Mexicans | 0.0 /100 | #333 | Tragic $33,664 |
| Spanish American Indians | 0.0 /100 | #334 | Tragic $33,625 |
| Creek | 0.0 /100 | #335 | Tragic $33,437 |
| Ottawa | 0.0 /100 | #336 | Tragic $33,378 |
| Yakama | 0.0 /100 | #337 | Tragic $33,354 |
| Immigrants | Cuba | 0.0 /100 | #338 | Tragic $33,291 |
| Immigrants | Mexico | 0.0 /100 | #339 | Tragic $33,236 |
| Tohono O'odham | 0.0 /100 | #340 | Tragic $33,205 |
| Navajo | 0.0 /100 | #341 | Tragic $33,046 |
| Yup'ik | 0.0 /100 | #342 | Tragic $32,730 |
| Pueblo | 0.0 /100 | #343 | Tragic $32,564 |
| Lumbee | 0.0 /100 | #344 | Tragic $32,500 |
| Puerto Ricans | 0.0 /100 | #345 | Tragic $31,560 |
| Arapaho | 0.0 /100 | #346 | Tragic $31,489 |
| Houma | 0.0 /100 | #347 | Tragic $30,343 |
Demographics Similar to Immigrants from Cabo Verde by Median Female Earnings
In terms of median female earnings, the demographic groups most similar to Immigrants from Cabo Verde are Sudanese ($38,215, a difference of 0.020%), Liberian ($38,215, a difference of 0.020%), Alaska Native ($38,202, a difference of 0.020%), English ($38,196, a difference of 0.030%), and Finnish ($38,173, a difference of 0.090%).
| Demographics | Rating | Rank | Median Female Earnings |
| Basques | 5.7 /100 | #230 | Tragic $38,352 |
| Somalis | 5.5 /100 | #231 | Tragic $38,333 |
| Scandinavians | 5.2 /100 | #232 | Tragic $38,306 |
| Tongans | 5.1 /100 | #233 | Tragic $38,288 |
| Celtics | 5.0 /100 | #234 | Tragic $38,283 |
| Sudanese | 4.4 /100 | #235 | Tragic $38,215 |
| Liberians | 4.4 /100 | #236 | Tragic $38,215 |
| Immigrants | Cabo Verde | 4.3 /100 | #237 | Tragic $38,208 |
| Alaska Natives | 4.3 /100 | #238 | Tragic $38,202 |
| English | 4.2 /100 | #239 | Tragic $38,196 |
| Finns | 4.0 /100 | #240 | Tragic $38,173 |
| Spanish | 3.5 /100 | #241 | Tragic $38,098 |
| Immigrants | Burma/Myanmar | 3.0 /100 | #242 | Tragic $38,028 |
| Germans | 2.8 /100 | #243 | Tragic $37,986 |
| Immigrants | Liberia | 2.7 /100 | #244 | Tragic $37,970 |