Houma vs Immigrants from Guyana Median Female Earnings
COMPARE
Houma
Immigrants from Guyana
Median Female Earnings
Median Female Earnings Comparison
Houma
Immigrants from Guyana
$30,343
MEDIAN FEMALE EARNINGS
0.0/ 100
METRIC RATING
347th/ 347
METRIC RANK
$40,773
MEDIAN FEMALE EARNINGS
90.3/ 100
METRIC RATING
130th/ 347
METRIC RANK
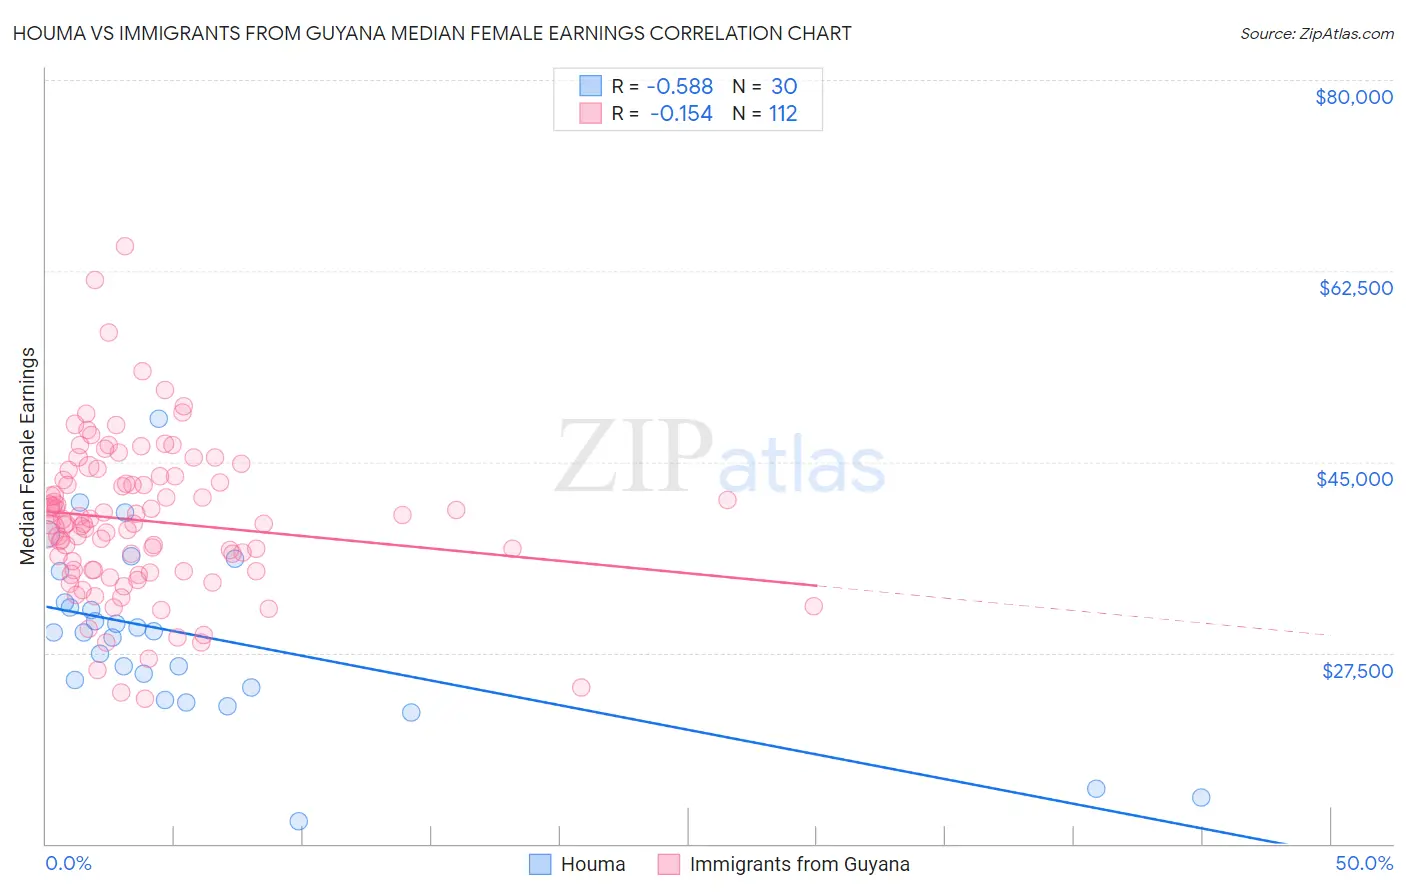
Houma vs Immigrants from Guyana Median Female Earnings Correlation Chart
The statistical analysis conducted on geographies consisting of 36,795,297 people shows a substantial negative correlation between the proportion of Houma and median female earnings in the United States with a correlation coefficient (R) of -0.588 and weighted average of $30,343. Similarly, the statistical analysis conducted on geographies consisting of 183,689,123 people shows a poor negative correlation between the proportion of Immigrants from Guyana and median female earnings in the United States with a correlation coefficient (R) of -0.154 and weighted average of $40,773, a difference of 34.4%.
Median Female Earnings Correlation Summary
| Measurement | Houma | Immigrants from Guyana |
| Minimum | $12,038 | $23,277 |
| Maximum | $48,900 | $64,779 |
| Range | $36,862 | $41,502 |
| Mean | $28,868 | $39,583 |
| Median | $29,403 | $39,337 |
| Interquartile 25% (IQ1) | $24,292 | $35,009 |
| Interquartile 75% (IQ3) | $32,114 | $43,513 |
| Interquartile Range (IQR) | $7,822 | $8,503 |
| Standard Deviation (Sample) | $8,016 | $7,079 |
| Standard Deviation (Population) | $7,881 | $7,048 |
Similar Demographics by Median Female Earnings
Demographics Similar to Houma by Median Female Earnings
In terms of median female earnings, the demographic groups most similar to Houma are Arapaho ($31,489, a difference of 3.8%), Puerto Rican ($31,560, a difference of 4.0%), Lumbee ($32,500, a difference of 7.1%), Pueblo ($32,564, a difference of 7.3%), and Yup'ik ($32,730, a difference of 7.9%).
| Demographics | Rating | Rank | Median Female Earnings |
| Mexicans | 0.0 /100 | #333 | Tragic $33,664 |
| Spanish American Indians | 0.0 /100 | #334 | Tragic $33,625 |
| Creek | 0.0 /100 | #335 | Tragic $33,437 |
| Ottawa | 0.0 /100 | #336 | Tragic $33,378 |
| Yakama | 0.0 /100 | #337 | Tragic $33,354 |
| Immigrants | Cuba | 0.0 /100 | #338 | Tragic $33,291 |
| Immigrants | Mexico | 0.0 /100 | #339 | Tragic $33,236 |
| Tohono O'odham | 0.0 /100 | #340 | Tragic $33,205 |
| Navajo | 0.0 /100 | #341 | Tragic $33,046 |
| Yup'ik | 0.0 /100 | #342 | Tragic $32,730 |
| Pueblo | 0.0 /100 | #343 | Tragic $32,564 |
| Lumbee | 0.0 /100 | #344 | Tragic $32,500 |
| Puerto Ricans | 0.0 /100 | #345 | Tragic $31,560 |
| Arapaho | 0.0 /100 | #346 | Tragic $31,489 |
| Houma | 0.0 /100 | #347 | Tragic $30,343 |
Demographics Similar to Immigrants from Guyana by Median Female Earnings
In terms of median female earnings, the demographic groups most similar to Immigrants from Guyana are Chilean ($40,757, a difference of 0.040%), Zimbabwean ($40,798, a difference of 0.060%), Immigrants from Uganda ($40,739, a difference of 0.080%), Syrian ($40,727, a difference of 0.11%), and Carpatho Rusyn ($40,825, a difference of 0.13%).
| Demographics | Rating | Rank | Median Female Earnings |
| Guyanese | 93.4 /100 | #123 | Exceptional $40,973 |
| Trinidadians and Tobagonians | 93.2 /100 | #124 | Exceptional $40,958 |
| Austrians | 92.7 /100 | #125 | Exceptional $40,923 |
| Immigrants | Trinidad and Tobago | 92.3 /100 | #126 | Exceptional $40,895 |
| Ugandans | 92.2 /100 | #127 | Exceptional $40,889 |
| Carpatho Rusyns | 91.2 /100 | #128 | Exceptional $40,825 |
| Zimbabweans | 90.8 /100 | #129 | Exceptional $40,798 |
| Immigrants | Guyana | 90.3 /100 | #130 | Exceptional $40,773 |
| Chileans | 90.0 /100 | #131 | Exceptional $40,757 |
| Immigrants | Uganda | 89.7 /100 | #132 | Excellent $40,739 |
| Syrians | 89.5 /100 | #133 | Excellent $40,727 |
| Arabs | 89.3 /100 | #134 | Excellent $40,718 |
| Immigrants | Nepal | 89.0 /100 | #135 | Excellent $40,704 |
| Immigrants | Eastern Africa | 87.7 /100 | #136 | Excellent $40,644 |
| Pakistanis | 86.6 /100 | #137 | Excellent $40,596 |