Immigrants from Burma/Myanmar vs Immigrants from Zimbabwe Median Female Earnings
COMPARE
Immigrants from Burma/Myanmar
Immigrants from Zimbabwe
Median Female Earnings
Median Female Earnings Comparison
Immigrants from Burma/Myanmar
Immigrants from Zimbabwe
$38,028
MEDIAN FEMALE EARNINGS
3.0/ 100
METRIC RATING
242nd/ 347
METRIC RANK
$41,527
MEDIAN FEMALE EARNINGS
97.8/ 100
METRIC RATING
104th/ 347
METRIC RANK
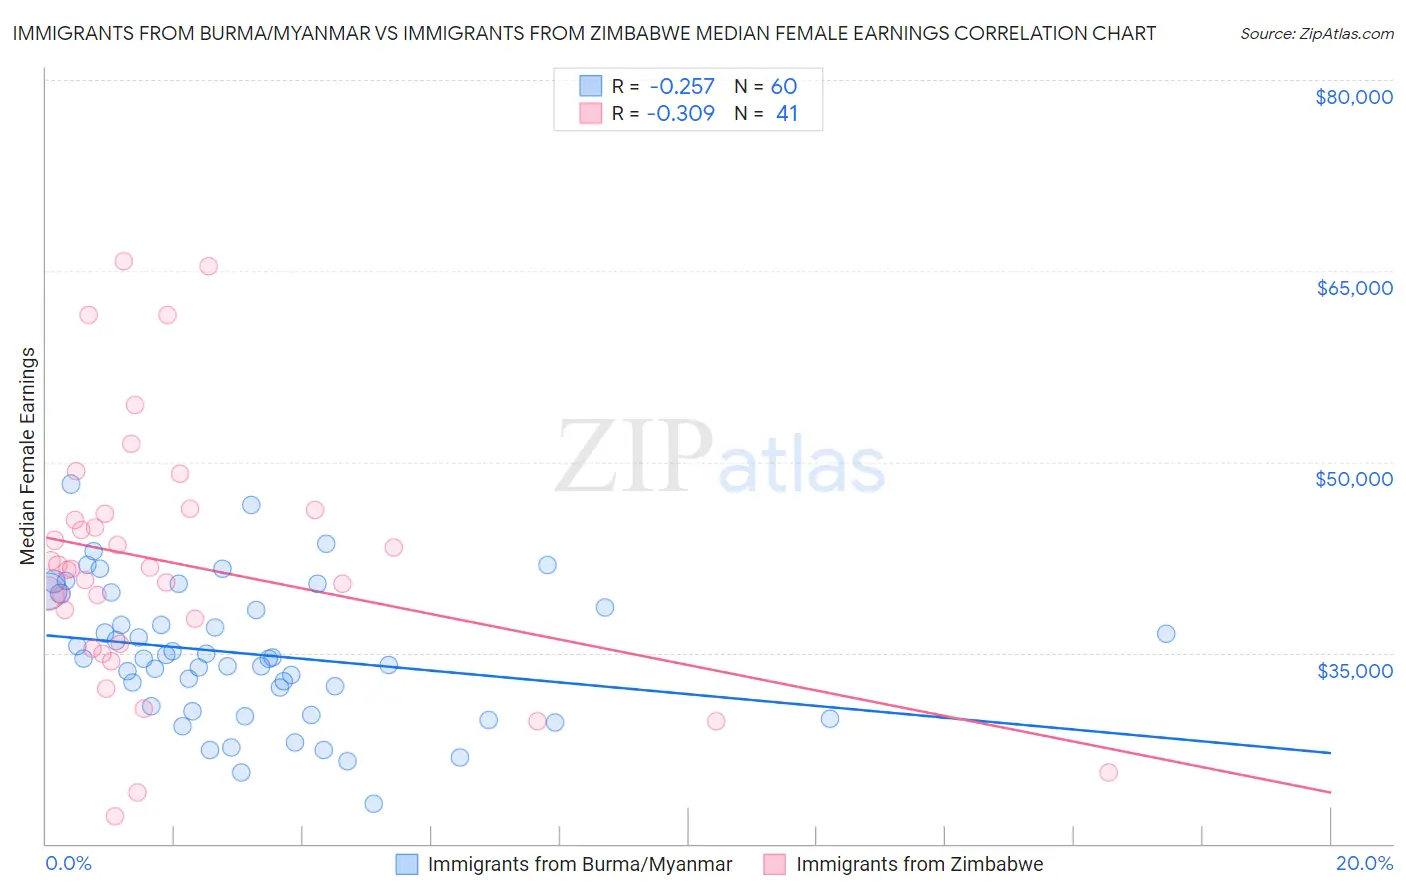
Immigrants from Burma/Myanmar vs Immigrants from Zimbabwe Median Female Earnings Correlation Chart
The statistical analysis conducted on geographies consisting of 172,347,432 people shows a weak negative correlation between the proportion of Immigrants from Burma/Myanmar and median female earnings in the United States with a correlation coefficient (R) of -0.257 and weighted average of $38,028. Similarly, the statistical analysis conducted on geographies consisting of 117,801,183 people shows a mild negative correlation between the proportion of Immigrants from Zimbabwe and median female earnings in the United States with a correlation coefficient (R) of -0.309 and weighted average of $41,527, a difference of 9.2%.
Median Female Earnings Correlation Summary
| Measurement | Immigrants from Burma/Myanmar | Immigrants from Zimbabwe |
| Minimum | $23,125 | $22,161 |
| Maximum | $48,239 | $65,750 |
| Range | $25,114 | $43,589 |
| Mean | $34,892 | $42,000 |
| Median | $34,545 | $41,577 |
| Interquartile 25% (IQ1) | $30,606 | $35,499 |
| Interquartile 75% (IQ3) | $39,132 | $46,072 |
| Interquartile Range (IQR) | $8,525 | $10,573 |
| Standard Deviation (Sample) | $5,366 | $10,097 |
| Standard Deviation (Population) | $5,321 | $9,973 |
Similar Demographics by Median Female Earnings
Demographics Similar to Immigrants from Burma/Myanmar by Median Female Earnings
In terms of median female earnings, the demographic groups most similar to Immigrants from Burma/Myanmar are German ($37,986, a difference of 0.11%), Immigrants from Liberia ($37,970, a difference of 0.15%), Immigrants from Middle Africa ($37,965, a difference of 0.17%), Delaware ($37,964, a difference of 0.17%), and Spanish ($38,098, a difference of 0.18%).
| Demographics | Rating | Rank | Median Female Earnings |
| Sudanese | 4.4 /100 | #235 | Tragic $38,215 |
| Liberians | 4.4 /100 | #236 | Tragic $38,215 |
| Immigrants | Cabo Verde | 4.3 /100 | #237 | Tragic $38,208 |
| Alaska Natives | 4.3 /100 | #238 | Tragic $38,202 |
| English | 4.2 /100 | #239 | Tragic $38,196 |
| Finns | 4.0 /100 | #240 | Tragic $38,173 |
| Spanish | 3.5 /100 | #241 | Tragic $38,098 |
| Immigrants | Burma/Myanmar | 3.0 /100 | #242 | Tragic $38,028 |
| Germans | 2.8 /100 | #243 | Tragic $37,986 |
| Immigrants | Liberia | 2.7 /100 | #244 | Tragic $37,970 |
| Immigrants | Middle Africa | 2.7 /100 | #245 | Tragic $37,965 |
| Delaware | 2.6 /100 | #246 | Tragic $37,964 |
| Immigrants | Somalia | 2.4 /100 | #247 | Tragic $37,914 |
| Alaskan Athabascans | 2.3 /100 | #248 | Tragic $37,905 |
| Swiss | 2.3 /100 | #249 | Tragic $37,904 |
Demographics Similar to Immigrants from Zimbabwe by Median Female Earnings
In terms of median female earnings, the demographic groups most similar to Immigrants from Zimbabwe are Italian ($41,505, a difference of 0.050%), Immigrants from Argentina ($41,554, a difference of 0.060%), Immigrants from Eritrea ($41,485, a difference of 0.10%), Palestinian ($41,484, a difference of 0.10%), and Jordanian ($41,464, a difference of 0.15%).
| Demographics | Rating | Rank | Median Female Earnings |
| Immigrants | Hungary | 98.8 /100 | #97 | Exceptional $41,820 |
| Immigrants | Scotland | 98.7 /100 | #98 | Exceptional $41,771 |
| Immigrants | Barbados | 98.4 /100 | #99 | Exceptional $41,685 |
| Romanians | 98.3 /100 | #100 | Exceptional $41,663 |
| Immigrants | Fiji | 98.3 /100 | #101 | Exceptional $41,656 |
| Immigrants | Poland | 98.2 /100 | #102 | Exceptional $41,630 |
| Immigrants | Argentina | 97.9 /100 | #103 | Exceptional $41,554 |
| Immigrants | Zimbabwe | 97.8 /100 | #104 | Exceptional $41,527 |
| Italians | 97.7 /100 | #105 | Exceptional $41,505 |
| Immigrants | Eritrea | 97.6 /100 | #106 | Exceptional $41,485 |
| Palestinians | 97.6 /100 | #107 | Exceptional $41,484 |
| Jordanians | 97.5 /100 | #108 | Exceptional $41,464 |
| Chinese | 97.5 /100 | #109 | Exceptional $41,461 |
| Immigrants | Western Asia | 97.0 /100 | #110 | Exceptional $41,375 |
| Immigrants | Canada | 97.0 /100 | #111 | Exceptional $41,373 |