Houma vs Immigrants from Latin America Median Female Earnings
COMPARE
Houma
Immigrants from Latin America
Median Female Earnings
Median Female Earnings Comparison
Houma
Immigrants from Latin America
$30,343
MEDIAN FEMALE EARNINGS
0.0/ 100
METRIC RATING
347th/ 347
METRIC RANK
$35,307
MEDIAN FEMALE EARNINGS
0.0/ 100
METRIC RATING
303rd/ 347
METRIC RANK
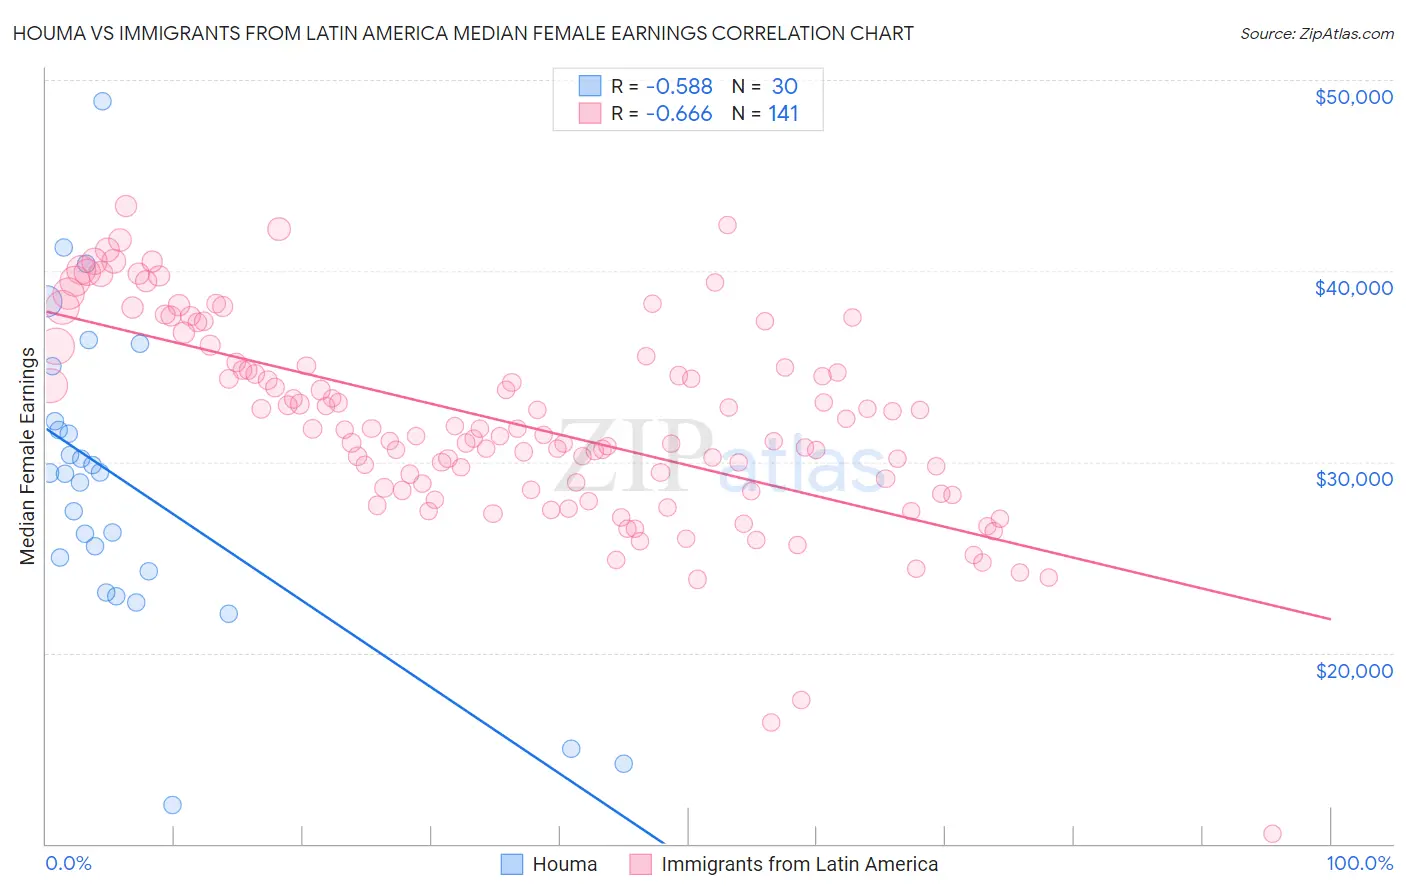
Houma vs Immigrants from Latin America Median Female Earnings Correlation Chart
The statistical analysis conducted on geographies consisting of 36,795,297 people shows a substantial negative correlation between the proportion of Houma and median female earnings in the United States with a correlation coefficient (R) of -0.588 and weighted average of $30,343. Similarly, the statistical analysis conducted on geographies consisting of 557,242,268 people shows a significant negative correlation between the proportion of Immigrants from Latin America and median female earnings in the United States with a correlation coefficient (R) of -0.666 and weighted average of $35,307, a difference of 16.4%.
Median Female Earnings Correlation Summary
| Measurement | Houma | Immigrants from Latin America |
| Minimum | $12,038 | $10,532 |
| Maximum | $48,900 | $43,408 |
| Range | $36,862 | $32,876 |
| Mean | $28,868 | $32,057 |
| Median | $29,403 | $31,685 |
| Interquartile 25% (IQ1) | $24,292 | $28,590 |
| Interquartile 75% (IQ3) | $32,114 | $35,130 |
| Interquartile Range (IQR) | $7,822 | $6,540 |
| Standard Deviation (Sample) | $8,016 | $5,280 |
| Standard Deviation (Population) | $7,881 | $5,261 |
Similar Demographics by Median Female Earnings
Demographics Similar to Houma by Median Female Earnings
In terms of median female earnings, the demographic groups most similar to Houma are Arapaho ($31,489, a difference of 3.8%), Puerto Rican ($31,560, a difference of 4.0%), Lumbee ($32,500, a difference of 7.1%), Pueblo ($32,564, a difference of 7.3%), and Yup'ik ($32,730, a difference of 7.9%).
| Demographics | Rating | Rank | Median Female Earnings |
| Mexicans | 0.0 /100 | #333 | Tragic $33,664 |
| Spanish American Indians | 0.0 /100 | #334 | Tragic $33,625 |
| Creek | 0.0 /100 | #335 | Tragic $33,437 |
| Ottawa | 0.0 /100 | #336 | Tragic $33,378 |
| Yakama | 0.0 /100 | #337 | Tragic $33,354 |
| Immigrants | Cuba | 0.0 /100 | #338 | Tragic $33,291 |
| Immigrants | Mexico | 0.0 /100 | #339 | Tragic $33,236 |
| Tohono O'odham | 0.0 /100 | #340 | Tragic $33,205 |
| Navajo | 0.0 /100 | #341 | Tragic $33,046 |
| Yup'ik | 0.0 /100 | #342 | Tragic $32,730 |
| Pueblo | 0.0 /100 | #343 | Tragic $32,564 |
| Lumbee | 0.0 /100 | #344 | Tragic $32,500 |
| Puerto Ricans | 0.0 /100 | #345 | Tragic $31,560 |
| Arapaho | 0.0 /100 | #346 | Tragic $31,489 |
| Houma | 0.0 /100 | #347 | Tragic $30,343 |
Demographics Similar to Immigrants from Latin America by Median Female Earnings
In terms of median female earnings, the demographic groups most similar to Immigrants from Latin America are Black/African American ($35,315, a difference of 0.020%), Pima ($35,326, a difference of 0.050%), Crow ($35,266, a difference of 0.11%), Yuman ($35,377, a difference of 0.20%), and Immigrants from Guatemala ($35,444, a difference of 0.39%).
| Demographics | Rating | Rank | Median Female Earnings |
| Mexican American Indians | 0.0 /100 | #296 | Tragic $35,629 |
| Hmong | 0.0 /100 | #297 | Tragic $35,498 |
| Immigrants | Micronesia | 0.0 /100 | #298 | Tragic $35,477 |
| Immigrants | Guatemala | 0.0 /100 | #299 | Tragic $35,444 |
| Yuman | 0.0 /100 | #300 | Tragic $35,377 |
| Pima | 0.0 /100 | #301 | Tragic $35,326 |
| Blacks/African Americans | 0.0 /100 | #302 | Tragic $35,315 |
| Immigrants | Latin America | 0.0 /100 | #303 | Tragic $35,307 |
| Crow | 0.0 /100 | #304 | Tragic $35,266 |
| Bahamians | 0.0 /100 | #305 | Tragic $35,125 |
| Fijians | 0.0 /100 | #306 | Tragic $35,114 |
| Sioux | 0.0 /100 | #307 | Tragic $35,063 |
| Immigrants | Bahamas | 0.0 /100 | #308 | Tragic $35,027 |
| Hondurans | 0.0 /100 | #309 | Tragic $35,013 |
| Chippewa | 0.0 /100 | #310 | Tragic $35,003 |