Comanche vs Immigrants from Zimbabwe Median Female Earnings
COMPARE
Comanche
Immigrants from Zimbabwe
Median Female Earnings
Median Female Earnings Comparison
Comanche
Immigrants from Zimbabwe
$35,661
MEDIAN FEMALE EARNINGS
0.0/ 100
METRIC RATING
295th/ 347
METRIC RANK
$41,527
MEDIAN FEMALE EARNINGS
97.8/ 100
METRIC RATING
104th/ 347
METRIC RANK
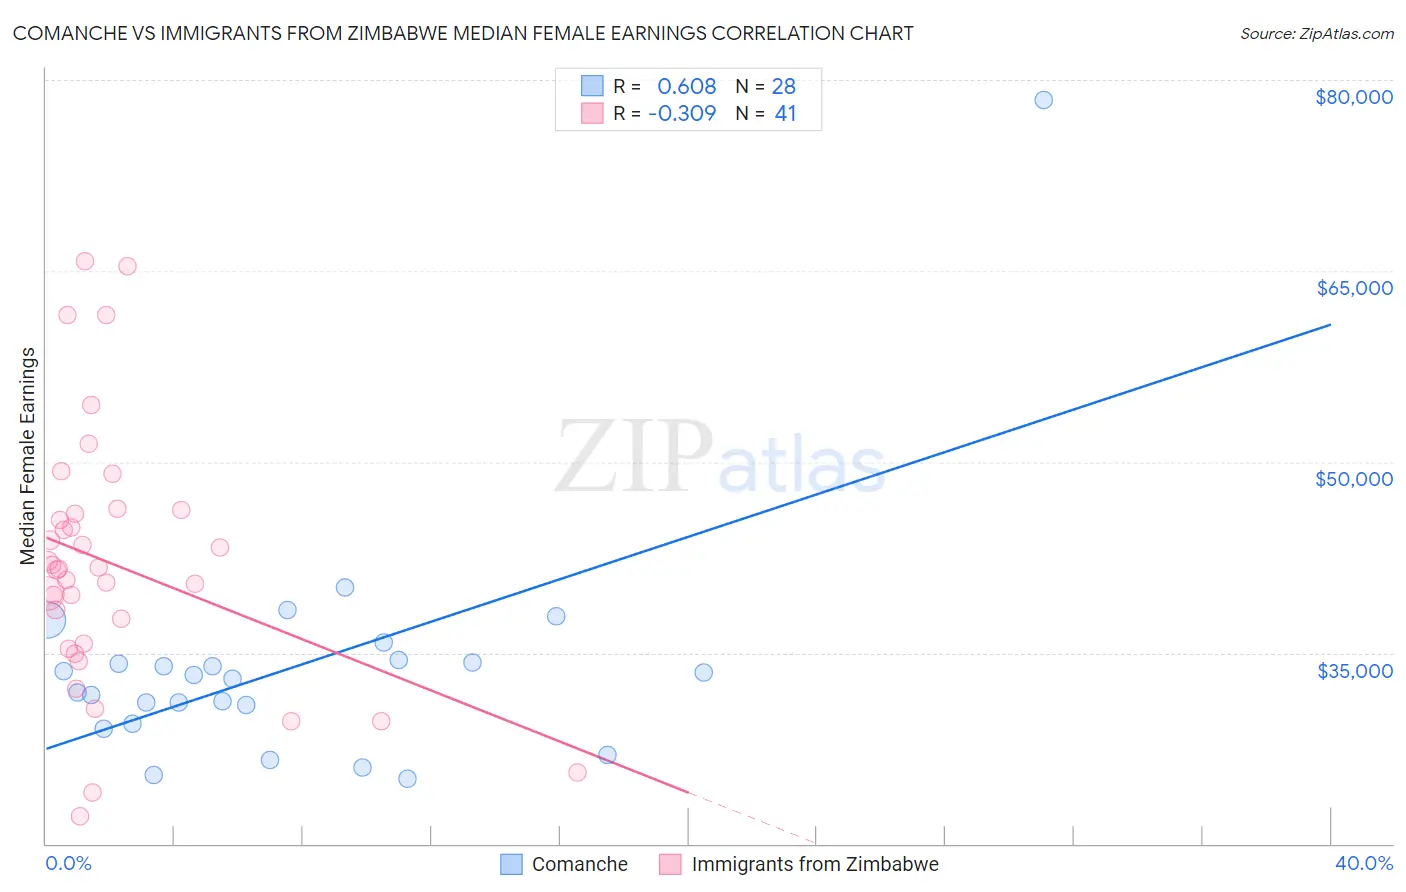
Comanche vs Immigrants from Zimbabwe Median Female Earnings Correlation Chart
The statistical analysis conducted on geographies consisting of 109,756,357 people shows a significant positive correlation between the proportion of Comanche and median female earnings in the United States with a correlation coefficient (R) of 0.608 and weighted average of $35,661. Similarly, the statistical analysis conducted on geographies consisting of 117,801,183 people shows a mild negative correlation between the proportion of Immigrants from Zimbabwe and median female earnings in the United States with a correlation coefficient (R) of -0.309 and weighted average of $41,527, a difference of 16.5%.
Median Female Earnings Correlation Summary
| Measurement | Comanche | Immigrants from Zimbabwe |
| Minimum | $25,100 | $22,161 |
| Maximum | $78,452 | $65,750 |
| Range | $53,352 | $43,589 |
| Mean | $33,877 | $42,000 |
| Median | $33,076 | $41,577 |
| Interquartile 25% (IQ1) | $30,131 | $35,499 |
| Interquartile 75% (IQ3) | $34,372 | $46,072 |
| Interquartile Range (IQR) | $4,241 | $10,573 |
| Standard Deviation (Sample) | $9,585 | $10,097 |
| Standard Deviation (Population) | $9,413 | $9,973 |
Similar Demographics by Median Female Earnings
Demographics Similar to Comanche by Median Female Earnings
In terms of median female earnings, the demographic groups most similar to Comanche are Cheyenne ($35,673, a difference of 0.030%), Guatemalan ($35,695, a difference of 0.090%), Mexican American Indian ($35,629, a difference of 0.090%), American ($35,777, a difference of 0.32%), and Hmong ($35,498, a difference of 0.46%).
| Demographics | Rating | Rank | Median Female Earnings |
| Immigrants | Zaire | 0.0 /100 | #288 | Tragic $36,017 |
| Bangladeshis | 0.0 /100 | #289 | Tragic $35,960 |
| Central American Indians | 0.0 /100 | #290 | Tragic $35,930 |
| Blackfeet | 0.0 /100 | #291 | Tragic $35,864 |
| Americans | 0.0 /100 | #292 | Tragic $35,777 |
| Guatemalans | 0.0 /100 | #293 | Tragic $35,695 |
| Cheyenne | 0.0 /100 | #294 | Tragic $35,673 |
| Comanche | 0.0 /100 | #295 | Tragic $35,661 |
| Mexican American Indians | 0.0 /100 | #296 | Tragic $35,629 |
| Hmong | 0.0 /100 | #297 | Tragic $35,498 |
| Immigrants | Micronesia | 0.0 /100 | #298 | Tragic $35,477 |
| Immigrants | Guatemala | 0.0 /100 | #299 | Tragic $35,444 |
| Yuman | 0.0 /100 | #300 | Tragic $35,377 |
| Pima | 0.0 /100 | #301 | Tragic $35,326 |
| Blacks/African Americans | 0.0 /100 | #302 | Tragic $35,315 |
Demographics Similar to Immigrants from Zimbabwe by Median Female Earnings
In terms of median female earnings, the demographic groups most similar to Immigrants from Zimbabwe are Italian ($41,505, a difference of 0.050%), Immigrants from Argentina ($41,554, a difference of 0.060%), Immigrants from Eritrea ($41,485, a difference of 0.10%), Palestinian ($41,484, a difference of 0.10%), and Jordanian ($41,464, a difference of 0.15%).
| Demographics | Rating | Rank | Median Female Earnings |
| Immigrants | Hungary | 98.8 /100 | #97 | Exceptional $41,820 |
| Immigrants | Scotland | 98.7 /100 | #98 | Exceptional $41,771 |
| Immigrants | Barbados | 98.4 /100 | #99 | Exceptional $41,685 |
| Romanians | 98.3 /100 | #100 | Exceptional $41,663 |
| Immigrants | Fiji | 98.3 /100 | #101 | Exceptional $41,656 |
| Immigrants | Poland | 98.2 /100 | #102 | Exceptional $41,630 |
| Immigrants | Argentina | 97.9 /100 | #103 | Exceptional $41,554 |
| Immigrants | Zimbabwe | 97.8 /100 | #104 | Exceptional $41,527 |
| Italians | 97.7 /100 | #105 | Exceptional $41,505 |
| Immigrants | Eritrea | 97.6 /100 | #106 | Exceptional $41,485 |
| Palestinians | 97.6 /100 | #107 | Exceptional $41,484 |
| Jordanians | 97.5 /100 | #108 | Exceptional $41,464 |
| Chinese | 97.5 /100 | #109 | Exceptional $41,461 |
| Immigrants | Western Asia | 97.0 /100 | #110 | Exceptional $41,375 |
| Immigrants | Canada | 97.0 /100 | #111 | Exceptional $41,373 |