Guamanian/Chamorro vs Immigrants from the Azores Per Capita Income
COMPARE
Guamanian/Chamorro
Immigrants from the Azores
Per Capita Income
Per Capita Income Comparison
Guamanians/Chamorros
Immigrants from the Azores
$41,678
PER CAPITA INCOME
9.7/ 100
METRIC RATING
217th/ 347
METRIC RANK
$39,608
PER CAPITA INCOME
1.0/ 100
METRIC RATING
252nd/ 347
METRIC RANK
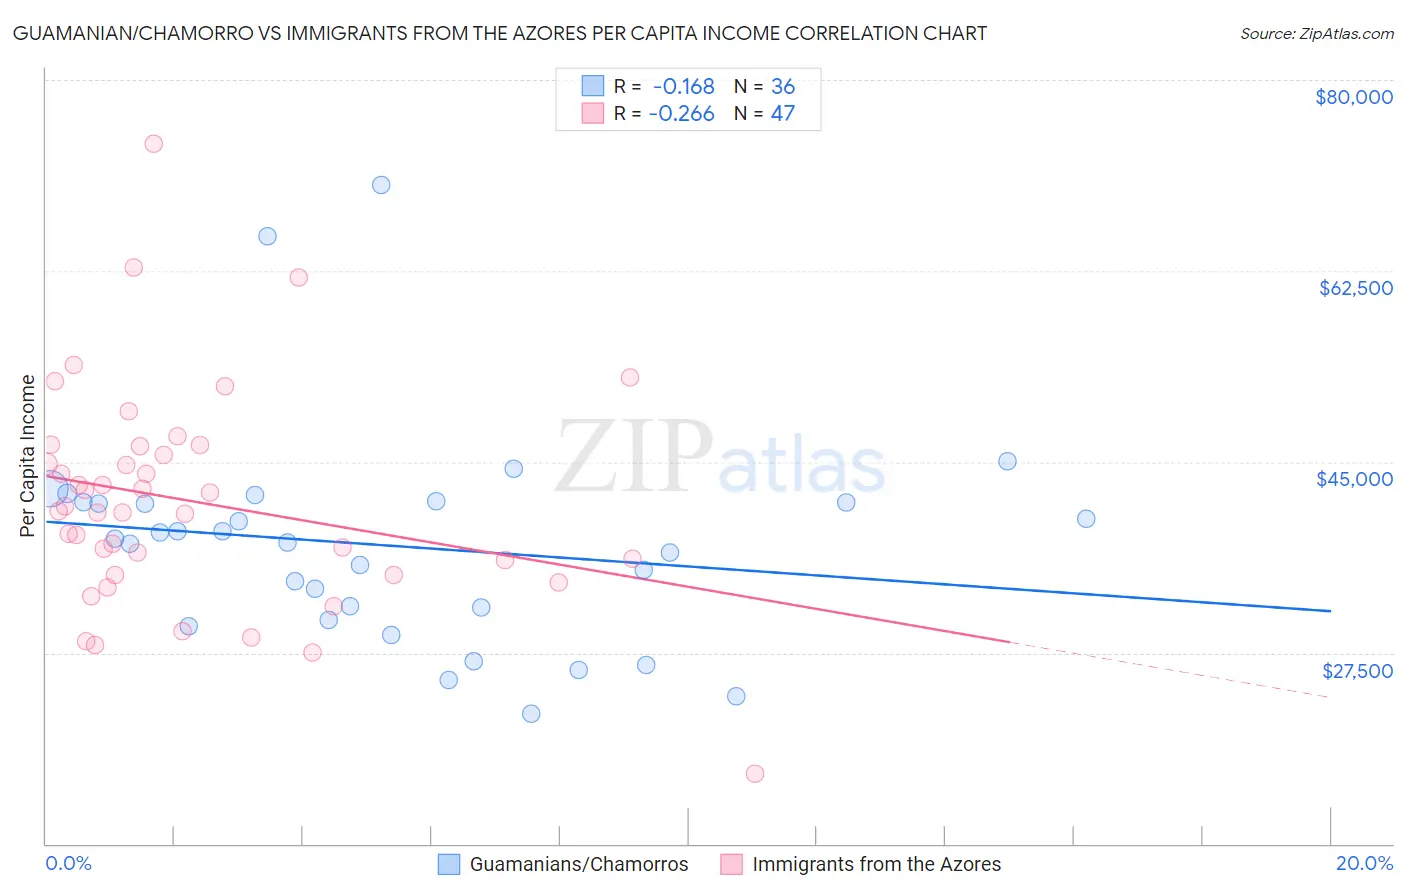
Guamanian/Chamorro vs Immigrants from the Azores Per Capita Income Correlation Chart
The statistical analysis conducted on geographies consisting of 221,916,418 people shows a poor negative correlation between the proportion of Guamanians/Chamorros and per capita income in the United States with a correlation coefficient (R) of -0.168 and weighted average of $41,678. Similarly, the statistical analysis conducted on geographies consisting of 46,254,060 people shows a weak negative correlation between the proportion of Immigrants from the Azores and per capita income in the United States with a correlation coefficient (R) of -0.266 and weighted average of $39,608, a difference of 5.2%.
Per Capita Income Correlation Summary
| Measurement | Guamanian/Chamorro | Immigrants from the Azores |
| Minimum | $21,937 | $16,377 |
| Maximum | $70,391 | $74,187 |
| Range | $48,454 | $57,810 |
| Mean | $37,325 | $41,323 |
| Median | $37,776 | $40,470 |
| Interquartile 25% (IQ1) | $31,068 | $34,672 |
| Interquartile 75% (IQ3) | $41,275 | $46,446 |
| Interquartile Range (IQR) | $10,207 | $11,774 |
| Standard Deviation (Sample) | $9,827 | $10,106 |
| Standard Deviation (Population) | $9,689 | $9,998 |
Similar Demographics by Per Capita Income
Demographics Similar to Guamanians/Chamorros by Per Capita Income
In terms of per capita income, the demographic groups most similar to Guamanians/Chamorros are Tongan ($41,693, a difference of 0.030%), Sudanese ($41,695, a difference of 0.040%), Trinidadian and Tobagonian ($41,655, a difference of 0.060%), Immigrants from Bangladesh ($41,709, a difference of 0.070%), and Immigrants from Venezuela ($41,727, a difference of 0.12%).
| Demographics | Rating | Rank | Per Capita Income |
| Ecuadorians | 12.9 /100 | #210 | Poor $41,958 |
| Immigrants | Panama | 11.6 /100 | #211 | Poor $41,853 |
| Immigrants | Senegal | 11.3 /100 | #212 | Poor $41,830 |
| Immigrants | Venezuela | 10.2 /100 | #213 | Poor $41,727 |
| Immigrants | Bangladesh | 10.1 /100 | #214 | Poor $41,709 |
| Sudanese | 9.9 /100 | #215 | Tragic $41,695 |
| Tongans | 9.9 /100 | #216 | Tragic $41,693 |
| Guamanians/Chamorros | 9.7 /100 | #217 | Tragic $41,678 |
| Trinidadians and Tobagonians | 9.5 /100 | #218 | Tragic $41,655 |
| Puget Sound Salish | 8.1 /100 | #219 | Tragic $41,495 |
| Immigrants | Barbados | 7.9 /100 | #220 | Tragic $41,478 |
| Immigrants | Trinidad and Tobago | 7.9 /100 | #221 | Tragic $41,476 |
| Immigrants | Iraq | 7.1 /100 | #222 | Tragic $41,365 |
| Immigrants | Cameroon | 6.8 /100 | #223 | Tragic $41,334 |
| Immigrants | St. Vincent and the Grenadines | 6.4 /100 | #224 | Tragic $41,270 |
Demographics Similar to Immigrants from the Azores by Per Capita Income
In terms of per capita income, the demographic groups most similar to Immigrants from the Azores are Osage ($39,568, a difference of 0.10%), Alaska Native ($39,558, a difference of 0.13%), Immigrants from Middle Africa ($39,529, a difference of 0.20%), Hawaiian ($39,403, a difference of 0.52%), and Immigrants from Burma/Myanmar ($39,827, a difference of 0.55%).
| Demographics | Rating | Rank | Per Capita Income |
| Sub-Saharan Africans | 1.9 /100 | #245 | Tragic $40,152 |
| Cree | 1.7 /100 | #246 | Tragic $40,056 |
| Immigrants | Somalia | 1.6 /100 | #247 | Tragic $39,974 |
| Cape Verdeans | 1.5 /100 | #248 | Tragic $39,935 |
| Japanese | 1.4 /100 | #249 | Tragic $39,870 |
| Immigrants | Burma/Myanmar | 1.3 /100 | #250 | Tragic $39,827 |
| Samoans | 1.3 /100 | #251 | Tragic $39,826 |
| Immigrants | Azores | 1.0 /100 | #252 | Tragic $39,608 |
| Osage | 1.0 /100 | #253 | Tragic $39,568 |
| Alaska Natives | 1.0 /100 | #254 | Tragic $39,558 |
| Immigrants | Middle Africa | 1.0 /100 | #255 | Tragic $39,529 |
| Hawaiians | 0.8 /100 | #256 | Tragic $39,403 |
| Nicaraguans | 0.8 /100 | #257 | Tragic $39,372 |
| Jamaicans | 0.7 /100 | #258 | Tragic $39,231 |
| Malaysians | 0.7 /100 | #259 | Tragic $39,194 |