Guamanian/Chamorro vs Sudanese Per Capita Income
COMPARE
Guamanian/Chamorro
Sudanese
Per Capita Income
Per Capita Income Comparison
Guamanians/Chamorros
Sudanese
$41,678
PER CAPITA INCOME
9.7/ 100
METRIC RATING
217th/ 347
METRIC RANK
$41,695
PER CAPITA INCOME
9.9/ 100
METRIC RATING
215th/ 347
METRIC RANK
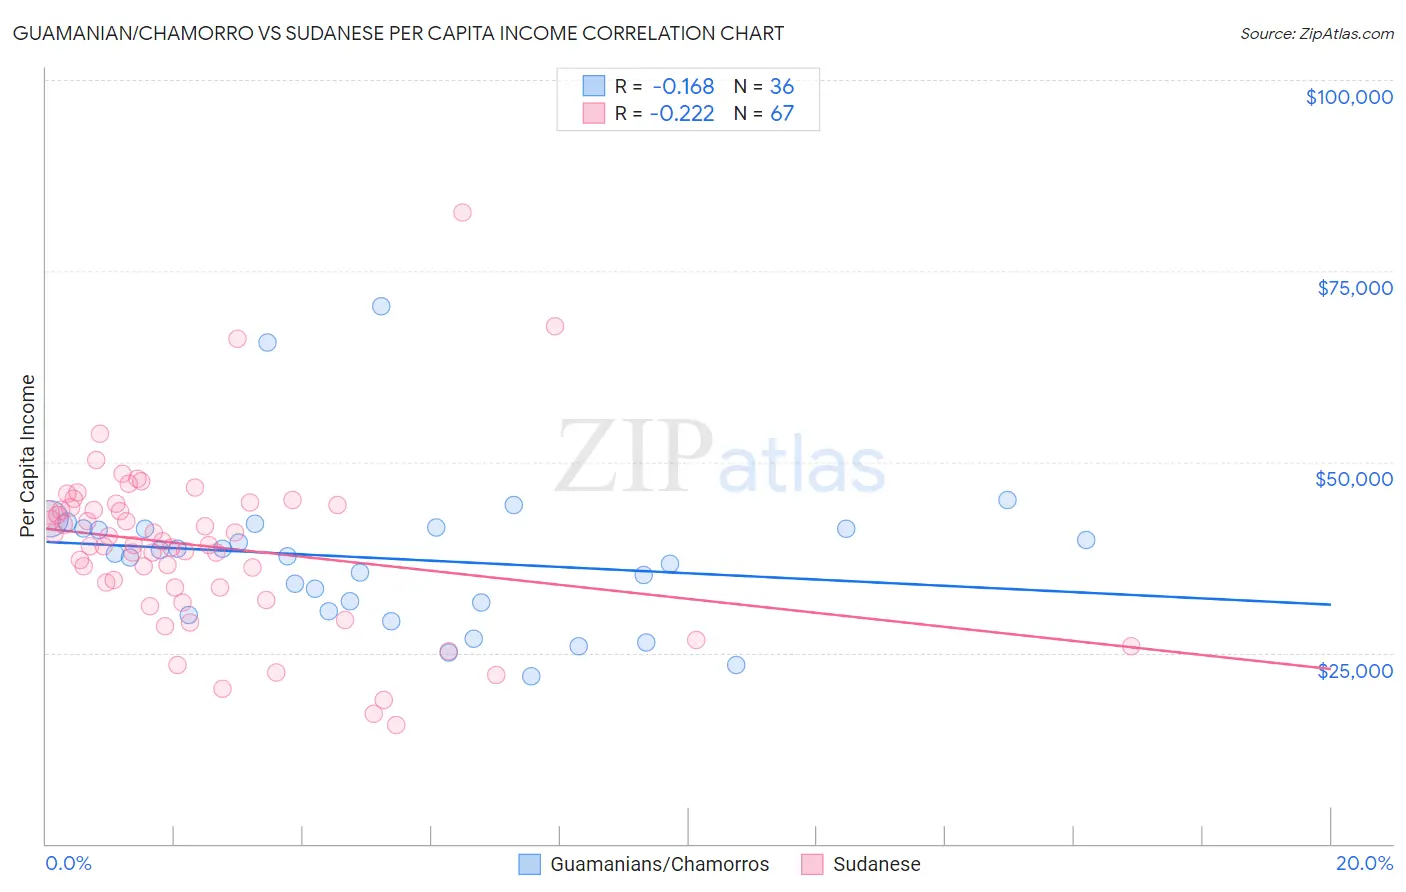
Guamanian/Chamorro vs Sudanese Per Capita Income Correlation Chart
The statistical analysis conducted on geographies consisting of 221,916,418 people shows a poor negative correlation between the proportion of Guamanians/Chamorros and per capita income in the United States with a correlation coefficient (R) of -0.168 and weighted average of $41,678. Similarly, the statistical analysis conducted on geographies consisting of 110,152,165 people shows a weak negative correlation between the proportion of Sudanese and per capita income in the United States with a correlation coefficient (R) of -0.222 and weighted average of $41,695, a difference of 0.040%.
Per Capita Income Correlation Summary
| Measurement | Guamanian/Chamorro | Sudanese |
| Minimum | $21,937 | $15,628 |
| Maximum | $70,391 | $82,685 |
| Range | $48,454 | $67,057 |
| Mean | $37,325 | $38,981 |
| Median | $37,776 | $39,137 |
| Interquartile 25% (IQ1) | $31,068 | $33,494 |
| Interquartile 75% (IQ3) | $41,275 | $44,276 |
| Interquartile Range (IQR) | $10,207 | $10,782 |
| Standard Deviation (Sample) | $9,827 | $11,237 |
| Standard Deviation (Population) | $9,689 | $11,153 |
Demographics Similar to Guamanians/Chamorros and Sudanese by Per Capita Income
In terms of per capita income, the demographic groups most similar to Guamanians/Chamorros are Tongan ($41,693, a difference of 0.030%), Trinidadian and Tobagonian ($41,655, a difference of 0.060%), Immigrants from Bangladesh ($41,709, a difference of 0.070%), Immigrants from Venezuela ($41,727, a difference of 0.12%), and Immigrants from Senegal ($41,830, a difference of 0.36%). Similarly, the demographic groups most similar to Sudanese are Tongan ($41,693, a difference of 0.010%), Immigrants from Bangladesh ($41,709, a difference of 0.030%), Immigrants from Venezuela ($41,727, a difference of 0.080%), Trinidadian and Tobagonian ($41,655, a difference of 0.10%), and Immigrants from Senegal ($41,830, a difference of 0.32%).
| Demographics | Rating | Rank | Per Capita Income |
| Ghanaians | 15.7 /100 | #206 | Poor $42,164 |
| Venezuelans | 14.4 /100 | #207 | Poor $42,074 |
| Panamanians | 13.9 /100 | #208 | Poor $42,035 |
| Immigrants | Sudan | 13.2 /100 | #209 | Poor $41,986 |
| Ecuadorians | 12.9 /100 | #210 | Poor $41,958 |
| Immigrants | Panama | 11.6 /100 | #211 | Poor $41,853 |
| Immigrants | Senegal | 11.3 /100 | #212 | Poor $41,830 |
| Immigrants | Venezuela | 10.2 /100 | #213 | Poor $41,727 |
| Immigrants | Bangladesh | 10.1 /100 | #214 | Poor $41,709 |
| Sudanese | 9.9 /100 | #215 | Tragic $41,695 |
| Tongans | 9.9 /100 | #216 | Tragic $41,693 |
| Guamanians/Chamorros | 9.7 /100 | #217 | Tragic $41,678 |
| Trinidadians and Tobagonians | 9.5 /100 | #218 | Tragic $41,655 |
| Puget Sound Salish | 8.1 /100 | #219 | Tragic $41,495 |
| Immigrants | Barbados | 7.9 /100 | #220 | Tragic $41,478 |
| Immigrants | Trinidad and Tobago | 7.9 /100 | #221 | Tragic $41,476 |
| Immigrants | Iraq | 7.1 /100 | #222 | Tragic $41,365 |
| Immigrants | Cameroon | 6.8 /100 | #223 | Tragic $41,334 |
| Immigrants | St. Vincent and the Grenadines | 6.4 /100 | #224 | Tragic $41,270 |
| West Indians | 6.0 /100 | #225 | Tragic $41,217 |
| Immigrants | Ecuador | 5.9 /100 | #226 | Tragic $41,195 |