Brazilian vs Immigrants from the Azores Per Capita Income
COMPARE
Brazilian
Immigrants from the Azores
Per Capita Income
Per Capita Income Comparison
Brazilians
Immigrants from the Azores
$46,700
PER CAPITA INCOME
96.8/ 100
METRIC RATING
104th/ 347
METRIC RANK
$39,608
PER CAPITA INCOME
1.0/ 100
METRIC RATING
252nd/ 347
METRIC RANK
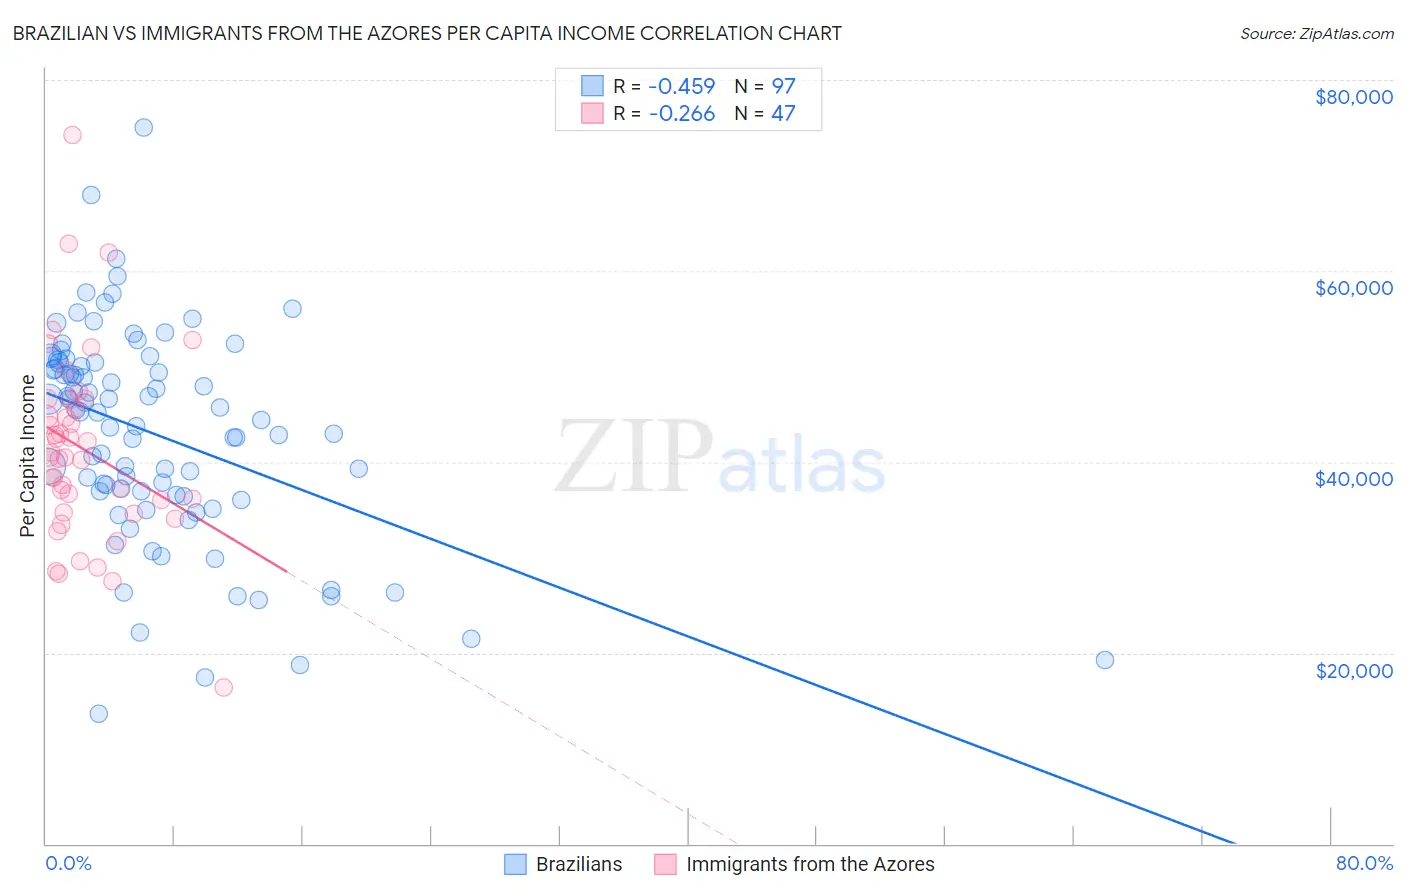
Brazilian vs Immigrants from the Azores Per Capita Income Correlation Chart
The statistical analysis conducted on geographies consisting of 323,990,504 people shows a moderate negative correlation between the proportion of Brazilians and per capita income in the United States with a correlation coefficient (R) of -0.459 and weighted average of $46,700. Similarly, the statistical analysis conducted on geographies consisting of 46,254,060 people shows a weak negative correlation between the proportion of Immigrants from the Azores and per capita income in the United States with a correlation coefficient (R) of -0.266 and weighted average of $39,608, a difference of 17.9%.
Per Capita Income Correlation Summary
| Measurement | Brazilian | Immigrants from the Azores |
| Minimum | $13,624 | $16,377 |
| Maximum | $75,068 | $74,187 |
| Range | $61,444 | $57,810 |
| Mean | $42,865 | $41,323 |
| Median | $45,205 | $40,470 |
| Interquartile 25% (IQ1) | $36,434 | $34,672 |
| Interquartile 75% (IQ3) | $50,401 | $46,446 |
| Interquartile Range (IQR) | $13,966 | $11,774 |
| Standard Deviation (Sample) | $11,177 | $10,106 |
| Standard Deviation (Population) | $11,120 | $9,998 |
Similar Demographics by Per Capita Income
Demographics Similar to Brazilians by Per Capita Income
In terms of per capita income, the demographic groups most similar to Brazilians are British ($46,571, a difference of 0.28%), Ethiopian ($46,569, a difference of 0.28%), Syrian ($46,837, a difference of 0.29%), Serbian ($46,551, a difference of 0.32%), and Immigrants from Kuwait ($46,543, a difference of 0.34%).
| Demographics | Rating | Rank | Per Capita Income |
| Carpatho Rusyns | 98.2 /100 | #97 | Exceptional $47,248 |
| Immigrants | Pakistan | 97.9 /100 | #98 | Exceptional $47,084 |
| Laotians | 97.8 /100 | #99 | Exceptional $47,041 |
| Immigrants | Lebanon | 97.5 /100 | #100 | Exceptional $46,938 |
| Immigrants | Uzbekistan | 97.5 /100 | #101 | Exceptional $46,929 |
| Immigrants | Western Asia | 97.4 /100 | #102 | Exceptional $46,876 |
| Syrians | 97.2 /100 | #103 | Exceptional $46,837 |
| Brazilians | 96.8 /100 | #104 | Exceptional $46,700 |
| British | 96.3 /100 | #105 | Exceptional $46,571 |
| Ethiopians | 96.3 /100 | #106 | Exceptional $46,569 |
| Serbians | 96.2 /100 | #107 | Exceptional $46,551 |
| Immigrants | Kuwait | 96.2 /100 | #108 | Exceptional $46,543 |
| Immigrants | Northern Africa | 96.2 /100 | #109 | Exceptional $46,531 |
| Chileans | 95.9 /100 | #110 | Exceptional $46,459 |
| Taiwanese | 95.8 /100 | #111 | Exceptional $46,455 |
Demographics Similar to Immigrants from the Azores by Per Capita Income
In terms of per capita income, the demographic groups most similar to Immigrants from the Azores are Osage ($39,568, a difference of 0.10%), Alaska Native ($39,558, a difference of 0.13%), Immigrants from Middle Africa ($39,529, a difference of 0.20%), Hawaiian ($39,403, a difference of 0.52%), and Immigrants from Burma/Myanmar ($39,827, a difference of 0.55%).
| Demographics | Rating | Rank | Per Capita Income |
| Sub-Saharan Africans | 1.9 /100 | #245 | Tragic $40,152 |
| Cree | 1.7 /100 | #246 | Tragic $40,056 |
| Immigrants | Somalia | 1.6 /100 | #247 | Tragic $39,974 |
| Cape Verdeans | 1.5 /100 | #248 | Tragic $39,935 |
| Japanese | 1.4 /100 | #249 | Tragic $39,870 |
| Immigrants | Burma/Myanmar | 1.3 /100 | #250 | Tragic $39,827 |
| Samoans | 1.3 /100 | #251 | Tragic $39,826 |
| Immigrants | Azores | 1.0 /100 | #252 | Tragic $39,608 |
| Osage | 1.0 /100 | #253 | Tragic $39,568 |
| Alaska Natives | 1.0 /100 | #254 | Tragic $39,558 |
| Immigrants | Middle Africa | 1.0 /100 | #255 | Tragic $39,529 |
| Hawaiians | 0.8 /100 | #256 | Tragic $39,403 |
| Nicaraguans | 0.8 /100 | #257 | Tragic $39,372 |
| Jamaicans | 0.7 /100 | #258 | Tragic $39,231 |
| Malaysians | 0.7 /100 | #259 | Tragic $39,194 |