Guamanian/Chamorro vs Immigrants from Belarus Per Capita Income
COMPARE
Guamanian/Chamorro
Immigrants from Belarus
Per Capita Income
Per Capita Income Comparison
Guamanians/Chamorros
Immigrants from Belarus
$41,678
PER CAPITA INCOME
9.7/ 100
METRIC RATING
217th/ 347
METRIC RANK
$50,303
PER CAPITA INCOME
99.9/ 100
METRIC RATING
54th/ 347
METRIC RANK
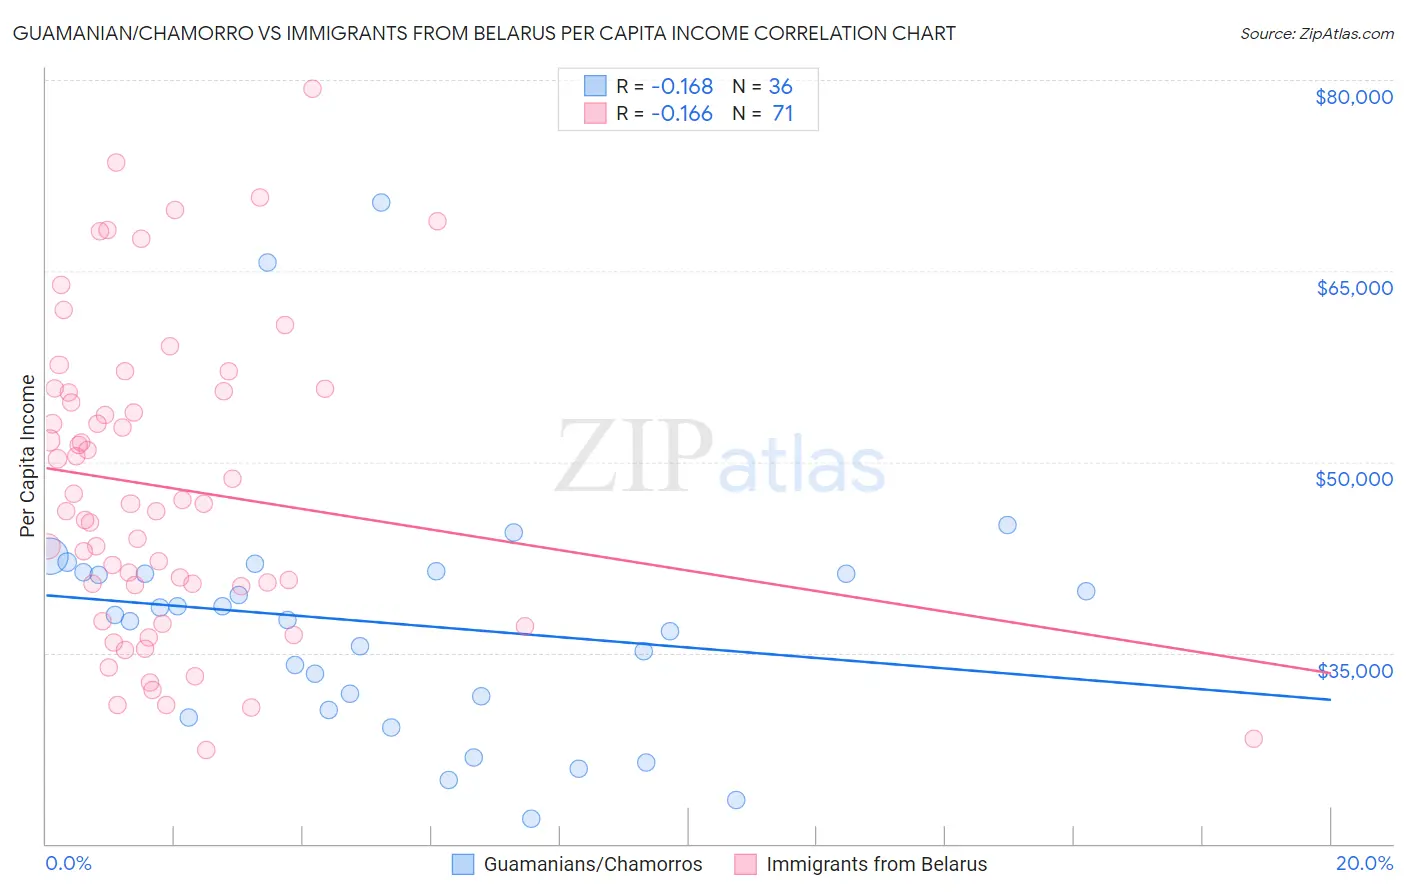
Guamanian/Chamorro vs Immigrants from Belarus Per Capita Income Correlation Chart
The statistical analysis conducted on geographies consisting of 221,916,418 people shows a poor negative correlation between the proportion of Guamanians/Chamorros and per capita income in the United States with a correlation coefficient (R) of -0.168 and weighted average of $41,678. Similarly, the statistical analysis conducted on geographies consisting of 150,188,651 people shows a poor negative correlation between the proportion of Immigrants from Belarus and per capita income in the United States with a correlation coefficient (R) of -0.166 and weighted average of $50,303, a difference of 20.7%.
Per Capita Income Correlation Summary
| Measurement | Guamanian/Chamorro | Immigrants from Belarus |
| Minimum | $21,937 | $27,382 |
| Maximum | $70,391 | $79,346 |
| Range | $48,454 | $51,964 |
| Mean | $37,325 | $47,977 |
| Median | $37,776 | $46,691 |
| Interquartile 25% (IQ1) | $31,068 | $40,275 |
| Interquartile 75% (IQ3) | $41,275 | $55,569 |
| Interquartile Range (IQR) | $10,207 | $15,294 |
| Standard Deviation (Sample) | $9,827 | $11,980 |
| Standard Deviation (Population) | $9,689 | $11,895 |
Similar Demographics by Per Capita Income
Demographics Similar to Guamanians/Chamorros by Per Capita Income
In terms of per capita income, the demographic groups most similar to Guamanians/Chamorros are Tongan ($41,693, a difference of 0.030%), Sudanese ($41,695, a difference of 0.040%), Trinidadian and Tobagonian ($41,655, a difference of 0.060%), Immigrants from Bangladesh ($41,709, a difference of 0.070%), and Immigrants from Venezuela ($41,727, a difference of 0.12%).
| Demographics | Rating | Rank | Per Capita Income |
| Ecuadorians | 12.9 /100 | #210 | Poor $41,958 |
| Immigrants | Panama | 11.6 /100 | #211 | Poor $41,853 |
| Immigrants | Senegal | 11.3 /100 | #212 | Poor $41,830 |
| Immigrants | Venezuela | 10.2 /100 | #213 | Poor $41,727 |
| Immigrants | Bangladesh | 10.1 /100 | #214 | Poor $41,709 |
| Sudanese | 9.9 /100 | #215 | Tragic $41,695 |
| Tongans | 9.9 /100 | #216 | Tragic $41,693 |
| Guamanians/Chamorros | 9.7 /100 | #217 | Tragic $41,678 |
| Trinidadians and Tobagonians | 9.5 /100 | #218 | Tragic $41,655 |
| Puget Sound Salish | 8.1 /100 | #219 | Tragic $41,495 |
| Immigrants | Barbados | 7.9 /100 | #220 | Tragic $41,478 |
| Immigrants | Trinidad and Tobago | 7.9 /100 | #221 | Tragic $41,476 |
| Immigrants | Iraq | 7.1 /100 | #222 | Tragic $41,365 |
| Immigrants | Cameroon | 6.8 /100 | #223 | Tragic $41,334 |
| Immigrants | St. Vincent and the Grenadines | 6.4 /100 | #224 | Tragic $41,270 |
Demographics Similar to Immigrants from Belarus by Per Capita Income
In terms of per capita income, the demographic groups most similar to Immigrants from Belarus are Paraguayan ($50,385, a difference of 0.16%), Immigrants from Croatia ($50,417, a difference of 0.23%), Immigrants from Netherlands ($50,458, a difference of 0.31%), Immigrants from Western Europe ($50,065, a difference of 0.48%), and Asian ($50,057, a difference of 0.49%).
| Demographics | Rating | Rank | Per Capita Income |
| Bulgarians | 100.0 /100 | #47 | Exceptional $50,906 |
| Immigrants | Serbia | 100.0 /100 | #48 | Exceptional $50,810 |
| New Zealanders | 100.0 /100 | #49 | Exceptional $50,575 |
| Immigrants | Sri Lanka | 100.0 /100 | #50 | Exceptional $50,555 |
| Immigrants | Netherlands | 100.0 /100 | #51 | Exceptional $50,458 |
| Immigrants | Croatia | 99.9 /100 | #52 | Exceptional $50,417 |
| Paraguayans | 99.9 /100 | #53 | Exceptional $50,385 |
| Immigrants | Belarus | 99.9 /100 | #54 | Exceptional $50,303 |
| Immigrants | Western Europe | 99.9 /100 | #55 | Exceptional $50,065 |
| Asians | 99.9 /100 | #56 | Exceptional $50,057 |
| South Africans | 99.9 /100 | #57 | Exceptional $50,044 |
| Immigrants | Malaysia | 99.9 /100 | #58 | Exceptional $49,983 |
| Bhutanese | 99.9 /100 | #59 | Exceptional $49,894 |
| Immigrants | Scotland | 99.9 /100 | #60 | Exceptional $49,893 |
| Argentineans | 99.9 /100 | #61 | Exceptional $49,862 |