Senegalese vs Immigrants from the Azores Per Capita Income
COMPARE
Senegalese
Immigrants from the Azores
Per Capita Income
Per Capita Income Comparison
Senegalese
Immigrants from the Azores
$41,000
PER CAPITA INCOME
4.8/ 100
METRIC RATING
231st/ 347
METRIC RANK
$39,608
PER CAPITA INCOME
1.0/ 100
METRIC RATING
252nd/ 347
METRIC RANK
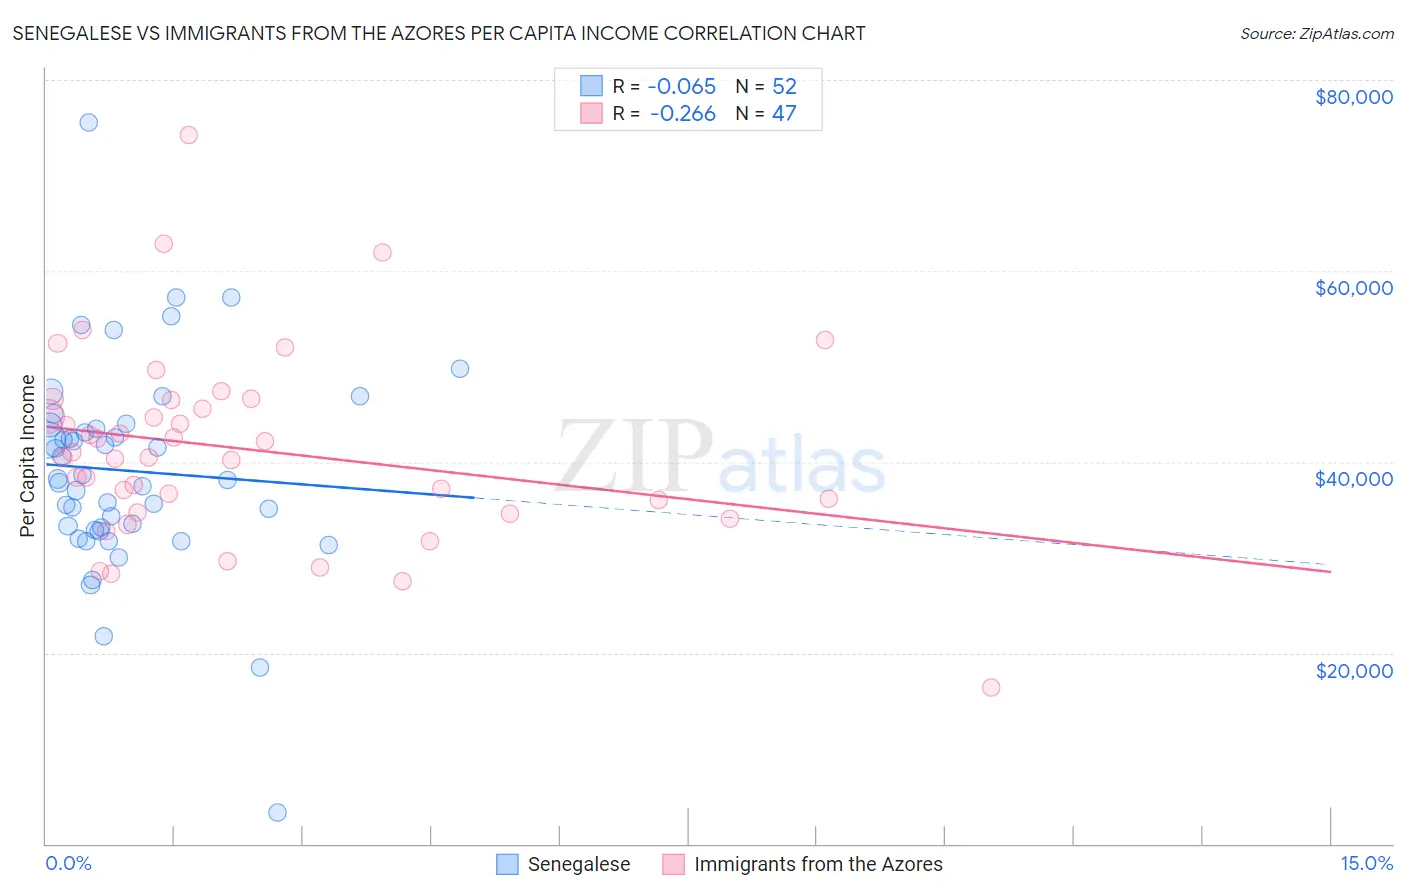
Senegalese vs Immigrants from the Azores Per Capita Income Correlation Chart
The statistical analysis conducted on geographies consisting of 78,107,792 people shows a slight negative correlation between the proportion of Senegalese and per capita income in the United States with a correlation coefficient (R) of -0.065 and weighted average of $41,000. Similarly, the statistical analysis conducted on geographies consisting of 46,254,060 people shows a weak negative correlation between the proportion of Immigrants from the Azores and per capita income in the United States with a correlation coefficient (R) of -0.266 and weighted average of $39,608, a difference of 3.5%.
Per Capita Income Correlation Summary
| Measurement | Senegalese | Immigrants from the Azores |
| Minimum | $3,219 | $16,377 |
| Maximum | $75,539 | $74,187 |
| Range | $72,320 | $57,810 |
| Mean | $39,064 | $41,323 |
| Median | $38,147 | $40,470 |
| Interquartile 25% (IQ1) | $33,014 | $34,672 |
| Interquartile 75% (IQ3) | $43,632 | $46,446 |
| Interquartile Range (IQR) | $10,618 | $11,774 |
| Standard Deviation (Sample) | $10,948 | $10,106 |
| Standard Deviation (Population) | $10,843 | $9,998 |
Similar Demographics by Per Capita Income
Demographics Similar to Senegalese by Per Capita Income
In terms of per capita income, the demographic groups most similar to Senegalese are Native Hawaiian ($41,017, a difference of 0.040%), Nigerian ($41,026, a difference of 0.060%), Guyanese ($40,949, a difference of 0.12%), Immigrants from Grenada ($41,123, a difference of 0.30%), and Immigrants from Ghana ($41,131, a difference of 0.32%).
| Demographics | Rating | Rank | Per Capita Income |
| Immigrants | St. Vincent and the Grenadines | 6.4 /100 | #224 | Tragic $41,270 |
| West Indians | 6.0 /100 | #225 | Tragic $41,217 |
| Immigrants | Ecuador | 5.9 /100 | #226 | Tragic $41,195 |
| Immigrants | Ghana | 5.5 /100 | #227 | Tragic $41,131 |
| Immigrants | Grenada | 5.5 /100 | #228 | Tragic $41,123 |
| Nigerians | 4.9 /100 | #229 | Tragic $41,026 |
| Native Hawaiians | 4.9 /100 | #230 | Tragic $41,017 |
| Senegalese | 4.8 /100 | #231 | Tragic $41,000 |
| Guyanese | 4.5 /100 | #232 | Tragic $40,949 |
| Delaware | 3.8 /100 | #233 | Tragic $40,778 |
| Immigrants | West Indies | 3.7 /100 | #234 | Tragic $40,763 |
| Immigrants | Guyana | 3.6 /100 | #235 | Tragic $40,742 |
| Immigrants | Nonimmigrants | 3.4 /100 | #236 | Tragic $40,669 |
| Immigrants | Cambodia | 2.6 /100 | #237 | Tragic $40,434 |
| Somalis | 2.4 /100 | #238 | Tragic $40,367 |
Demographics Similar to Immigrants from the Azores by Per Capita Income
In terms of per capita income, the demographic groups most similar to Immigrants from the Azores are Osage ($39,568, a difference of 0.10%), Alaska Native ($39,558, a difference of 0.13%), Immigrants from Middle Africa ($39,529, a difference of 0.20%), Hawaiian ($39,403, a difference of 0.52%), and Immigrants from Burma/Myanmar ($39,827, a difference of 0.55%).
| Demographics | Rating | Rank | Per Capita Income |
| Sub-Saharan Africans | 1.9 /100 | #245 | Tragic $40,152 |
| Cree | 1.7 /100 | #246 | Tragic $40,056 |
| Immigrants | Somalia | 1.6 /100 | #247 | Tragic $39,974 |
| Cape Verdeans | 1.5 /100 | #248 | Tragic $39,935 |
| Japanese | 1.4 /100 | #249 | Tragic $39,870 |
| Immigrants | Burma/Myanmar | 1.3 /100 | #250 | Tragic $39,827 |
| Samoans | 1.3 /100 | #251 | Tragic $39,826 |
| Immigrants | Azores | 1.0 /100 | #252 | Tragic $39,608 |
| Osage | 1.0 /100 | #253 | Tragic $39,568 |
| Alaska Natives | 1.0 /100 | #254 | Tragic $39,558 |
| Immigrants | Middle Africa | 1.0 /100 | #255 | Tragic $39,529 |
| Hawaiians | 0.8 /100 | #256 | Tragic $39,403 |
| Nicaraguans | 0.8 /100 | #257 | Tragic $39,372 |
| Jamaicans | 0.7 /100 | #258 | Tragic $39,231 |
| Malaysians | 0.7 /100 | #259 | Tragic $39,194 |