Guamanian/Chamorro vs Cheyenne Per Capita Income
COMPARE
Guamanian/Chamorro
Cheyenne
Per Capita Income
Per Capita Income Comparison
Guamanians/Chamorros
Cheyenne
$41,678
PER CAPITA INCOME
9.7/ 100
METRIC RATING
217th/ 347
METRIC RANK
$35,276
PER CAPITA INCOME
0.0/ 100
METRIC RATING
323rd/ 347
METRIC RANK
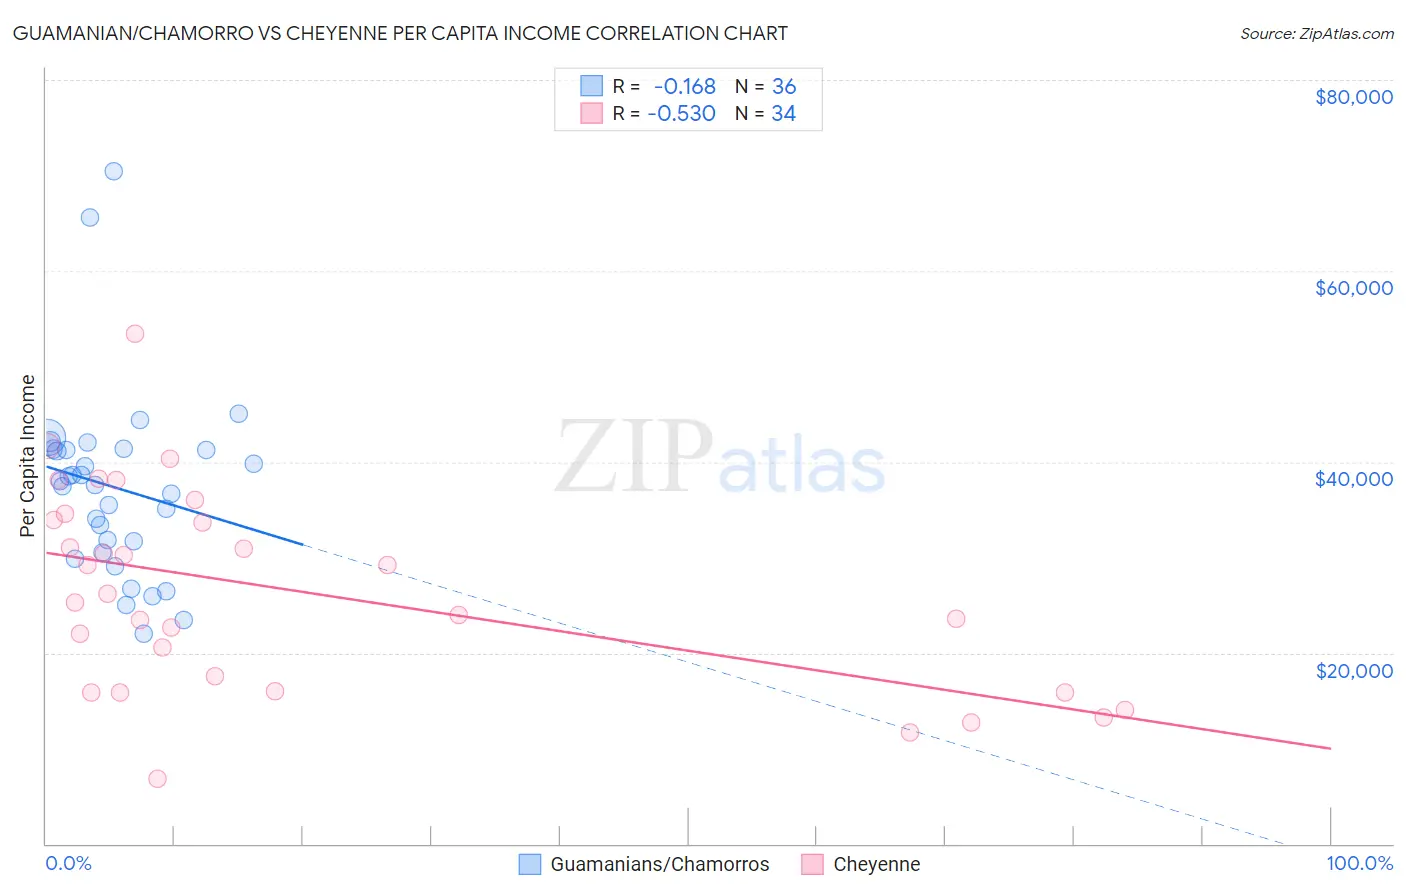
Guamanian/Chamorro vs Cheyenne Per Capita Income Correlation Chart
The statistical analysis conducted on geographies consisting of 221,916,418 people shows a poor negative correlation between the proportion of Guamanians/Chamorros and per capita income in the United States with a correlation coefficient (R) of -0.168 and weighted average of $41,678. Similarly, the statistical analysis conducted on geographies consisting of 80,722,590 people shows a substantial negative correlation between the proportion of Cheyenne and per capita income in the United States with a correlation coefficient (R) of -0.530 and weighted average of $35,276, a difference of 18.1%.
Per Capita Income Correlation Summary
| Measurement | Guamanian/Chamorro | Cheyenne |
| Minimum | $21,937 | $6,772 |
| Maximum | $70,391 | $53,471 |
| Range | $48,454 | $46,699 |
| Mean | $37,325 | $26,352 |
| Median | $37,776 | $25,776 |
| Interquartile 25% (IQ1) | $31,068 | $15,918 |
| Interquartile 75% (IQ3) | $41,275 | $33,955 |
| Interquartile Range (IQR) | $10,207 | $18,037 |
| Standard Deviation (Sample) | $9,827 | $10,544 |
| Standard Deviation (Population) | $9,689 | $10,388 |
Similar Demographics by Per Capita Income
Demographics Similar to Guamanians/Chamorros by Per Capita Income
In terms of per capita income, the demographic groups most similar to Guamanians/Chamorros are Tongan ($41,693, a difference of 0.030%), Sudanese ($41,695, a difference of 0.040%), Trinidadian and Tobagonian ($41,655, a difference of 0.060%), Immigrants from Bangladesh ($41,709, a difference of 0.070%), and Immigrants from Venezuela ($41,727, a difference of 0.12%).
| Demographics | Rating | Rank | Per Capita Income |
| Ecuadorians | 12.9 /100 | #210 | Poor $41,958 |
| Immigrants | Panama | 11.6 /100 | #211 | Poor $41,853 |
| Immigrants | Senegal | 11.3 /100 | #212 | Poor $41,830 |
| Immigrants | Venezuela | 10.2 /100 | #213 | Poor $41,727 |
| Immigrants | Bangladesh | 10.1 /100 | #214 | Poor $41,709 |
| Sudanese | 9.9 /100 | #215 | Tragic $41,695 |
| Tongans | 9.9 /100 | #216 | Tragic $41,693 |
| Guamanians/Chamorros | 9.7 /100 | #217 | Tragic $41,678 |
| Trinidadians and Tobagonians | 9.5 /100 | #218 | Tragic $41,655 |
| Puget Sound Salish | 8.1 /100 | #219 | Tragic $41,495 |
| Immigrants | Barbados | 7.9 /100 | #220 | Tragic $41,478 |
| Immigrants | Trinidad and Tobago | 7.9 /100 | #221 | Tragic $41,476 |
| Immigrants | Iraq | 7.1 /100 | #222 | Tragic $41,365 |
| Immigrants | Cameroon | 6.8 /100 | #223 | Tragic $41,334 |
| Immigrants | St. Vincent and the Grenadines | 6.4 /100 | #224 | Tragic $41,270 |
Demographics Similar to Cheyenne by Per Capita Income
In terms of per capita income, the demographic groups most similar to Cheyenne are Kiowa ($35,102, a difference of 0.50%), Creek ($35,546, a difference of 0.76%), Black/African American ($35,564, a difference of 0.82%), Immigrants from Central America ($34,974, a difference of 0.87%), and Immigrants from Cuba ($34,910, a difference of 1.1%).
| Demographics | Rating | Rank | Per Capita Income |
| Choctaw | 0.0 /100 | #316 | Tragic $35,999 |
| Dutch West Indians | 0.0 /100 | #317 | Tragic $35,922 |
| Bangladeshis | 0.0 /100 | #318 | Tragic $35,897 |
| Immigrants | Congo | 0.0 /100 | #319 | Tragic $35,720 |
| Hispanics or Latinos | 0.0 /100 | #320 | Tragic $35,688 |
| Blacks/African Americans | 0.0 /100 | #321 | Tragic $35,564 |
| Creek | 0.0 /100 | #322 | Tragic $35,546 |
| Cheyenne | 0.0 /100 | #323 | Tragic $35,276 |
| Kiowa | 0.0 /100 | #324 | Tragic $35,102 |
| Immigrants | Central America | 0.0 /100 | #325 | Tragic $34,974 |
| Immigrants | Cuba | 0.0 /100 | #326 | Tragic $34,910 |
| Apache | 0.0 /100 | #327 | Tragic $34,886 |
| Menominee | 0.0 /100 | #328 | Tragic $34,578 |
| Mexicans | 0.0 /100 | #329 | Tragic $34,559 |
| Spanish American Indians | 0.0 /100 | #330 | Tragic $34,195 |