Guamanian/Chamorro vs Basque Per Capita Income
COMPARE
Guamanian/Chamorro
Basque
Per Capita Income
Per Capita Income Comparison
Guamanians/Chamorros
Basques
$41,678
PER CAPITA INCOME
9.7/ 100
METRIC RATING
217th/ 347
METRIC RANK
$45,086
PER CAPITA INCOME
83.2/ 100
METRIC RATING
139th/ 347
METRIC RANK
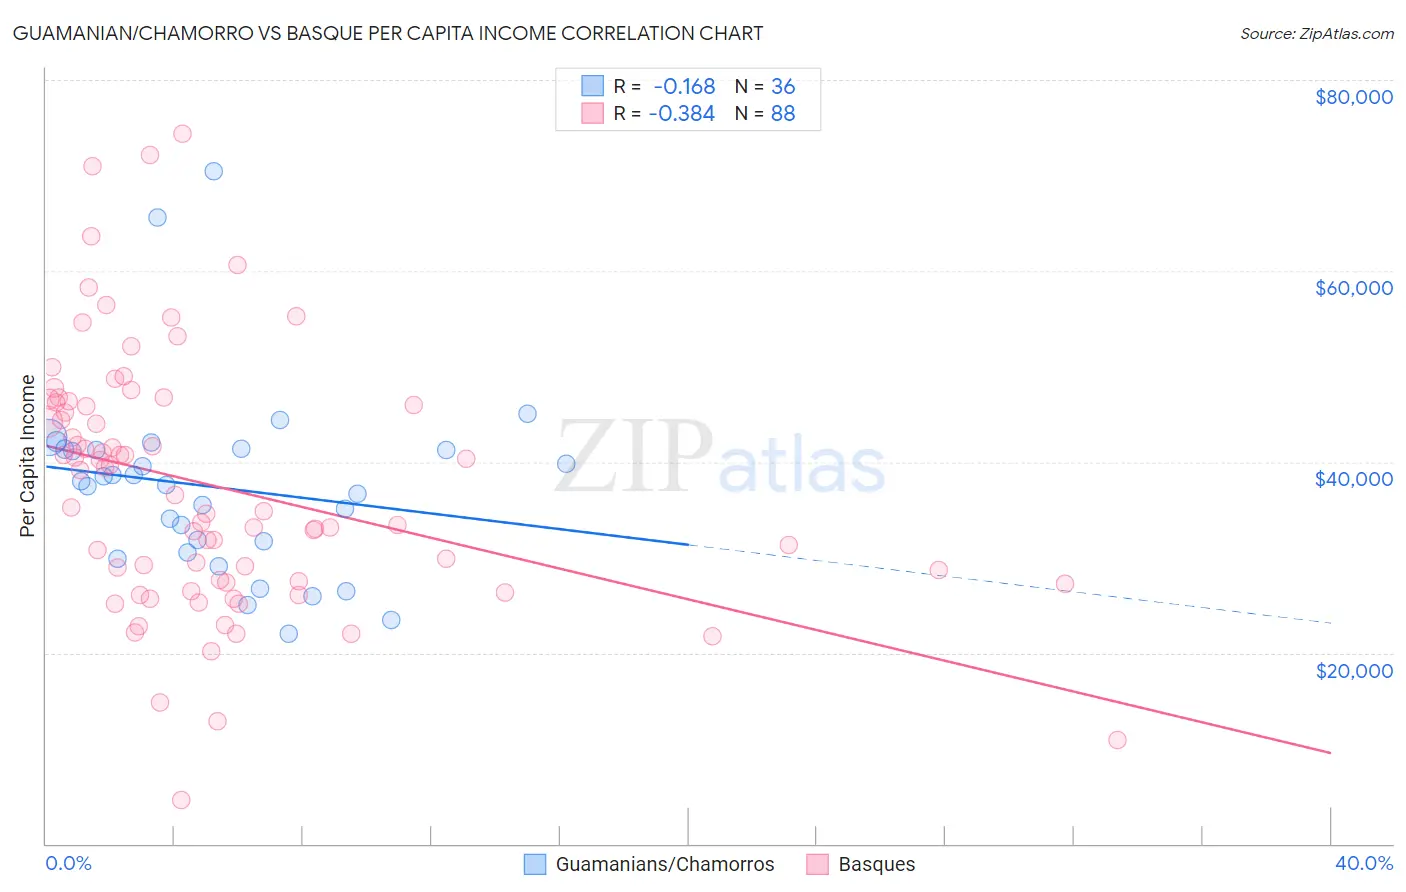
Guamanian/Chamorro vs Basque Per Capita Income Correlation Chart
The statistical analysis conducted on geographies consisting of 221,916,418 people shows a poor negative correlation between the proportion of Guamanians/Chamorros and per capita income in the United States with a correlation coefficient (R) of -0.168 and weighted average of $41,678. Similarly, the statistical analysis conducted on geographies consisting of 165,779,827 people shows a mild negative correlation between the proportion of Basques and per capita income in the United States with a correlation coefficient (R) of -0.384 and weighted average of $45,086, a difference of 8.2%.
Per Capita Income Correlation Summary
| Measurement | Guamanian/Chamorro | Basque |
| Minimum | $21,937 | $4,617 |
| Maximum | $70,391 | $74,412 |
| Range | $48,454 | $69,795 |
| Mean | $37,325 | $37,448 |
| Median | $37,776 | $35,882 |
| Interquartile 25% (IQ1) | $31,068 | $27,463 |
| Interquartile 75% (IQ3) | $41,275 | $46,112 |
| Interquartile Range (IQR) | $10,207 | $18,649 |
| Standard Deviation (Sample) | $9,827 | $13,380 |
| Standard Deviation (Population) | $9,689 | $13,304 |
Similar Demographics by Per Capita Income
Demographics Similar to Guamanians/Chamorros by Per Capita Income
In terms of per capita income, the demographic groups most similar to Guamanians/Chamorros are Tongan ($41,693, a difference of 0.030%), Sudanese ($41,695, a difference of 0.040%), Trinidadian and Tobagonian ($41,655, a difference of 0.060%), Immigrants from Bangladesh ($41,709, a difference of 0.070%), and Immigrants from Venezuela ($41,727, a difference of 0.12%).
| Demographics | Rating | Rank | Per Capita Income |
| Ecuadorians | 12.9 /100 | #210 | Poor $41,958 |
| Immigrants | Panama | 11.6 /100 | #211 | Poor $41,853 |
| Immigrants | Senegal | 11.3 /100 | #212 | Poor $41,830 |
| Immigrants | Venezuela | 10.2 /100 | #213 | Poor $41,727 |
| Immigrants | Bangladesh | 10.1 /100 | #214 | Poor $41,709 |
| Sudanese | 9.9 /100 | #215 | Tragic $41,695 |
| Tongans | 9.9 /100 | #216 | Tragic $41,693 |
| Guamanians/Chamorros | 9.7 /100 | #217 | Tragic $41,678 |
| Trinidadians and Tobagonians | 9.5 /100 | #218 | Tragic $41,655 |
| Puget Sound Salish | 8.1 /100 | #219 | Tragic $41,495 |
| Immigrants | Barbados | 7.9 /100 | #220 | Tragic $41,478 |
| Immigrants | Trinidad and Tobago | 7.9 /100 | #221 | Tragic $41,476 |
| Immigrants | Iraq | 7.1 /100 | #222 | Tragic $41,365 |
| Immigrants | Cameroon | 6.8 /100 | #223 | Tragic $41,334 |
| Immigrants | St. Vincent and the Grenadines | 6.4 /100 | #224 | Tragic $41,270 |
Demographics Similar to Basques by Per Capita Income
In terms of per capita income, the demographic groups most similar to Basques are Immigrants from Jordan ($45,066, a difference of 0.050%), Slavic ($45,049, a difference of 0.080%), Ugandan ($45,047, a difference of 0.090%), Immigrants from Uganda ($45,043, a difference of 0.10%), and Icelander ($44,987, a difference of 0.22%).
| Demographics | Rating | Rank | Per Capita Income |
| Jordanians | 89.9 /100 | #132 | Excellent $45,605 |
| Pakistanis | 89.7 /100 | #133 | Excellent $45,587 |
| Slovenes | 89.6 /100 | #134 | Excellent $45,581 |
| Hungarians | 87.9 /100 | #135 | Excellent $45,426 |
| Immigrants | Oceania | 85.2 /100 | #136 | Excellent $45,220 |
| Immigrants | Syria | 85.2 /100 | #137 | Excellent $45,218 |
| Assyrians/Chaldeans/Syriacs | 84.8 /100 | #138 | Excellent $45,195 |
| Basques | 83.2 /100 | #139 | Excellent $45,086 |
| Immigrants | Jordan | 82.9 /100 | #140 | Excellent $45,066 |
| Slavs | 82.6 /100 | #141 | Excellent $45,049 |
| Ugandans | 82.6 /100 | #142 | Excellent $45,047 |
| Immigrants | Uganda | 82.5 /100 | #143 | Excellent $45,043 |
| Icelanders | 81.6 /100 | #144 | Excellent $44,987 |
| Immigrants | Afghanistan | 78.0 /100 | #145 | Good $44,790 |
| Irish | 75.8 /100 | #146 | Good $44,679 |