Fijian vs Immigrants from Greece Median Male Earnings
COMPARE
Fijian
Immigrants from Greece
Median Male Earnings
Median Male Earnings Comparison
Fijians
Immigrants from Greece
$45,607
MEDIAN MALE EARNINGS
0.0/ 100
METRIC RATING
321st/ 347
METRIC RANK
$62,689
MEDIAN MALE EARNINGS
100.0/ 100
METRIC RATING
42nd/ 347
METRIC RANK
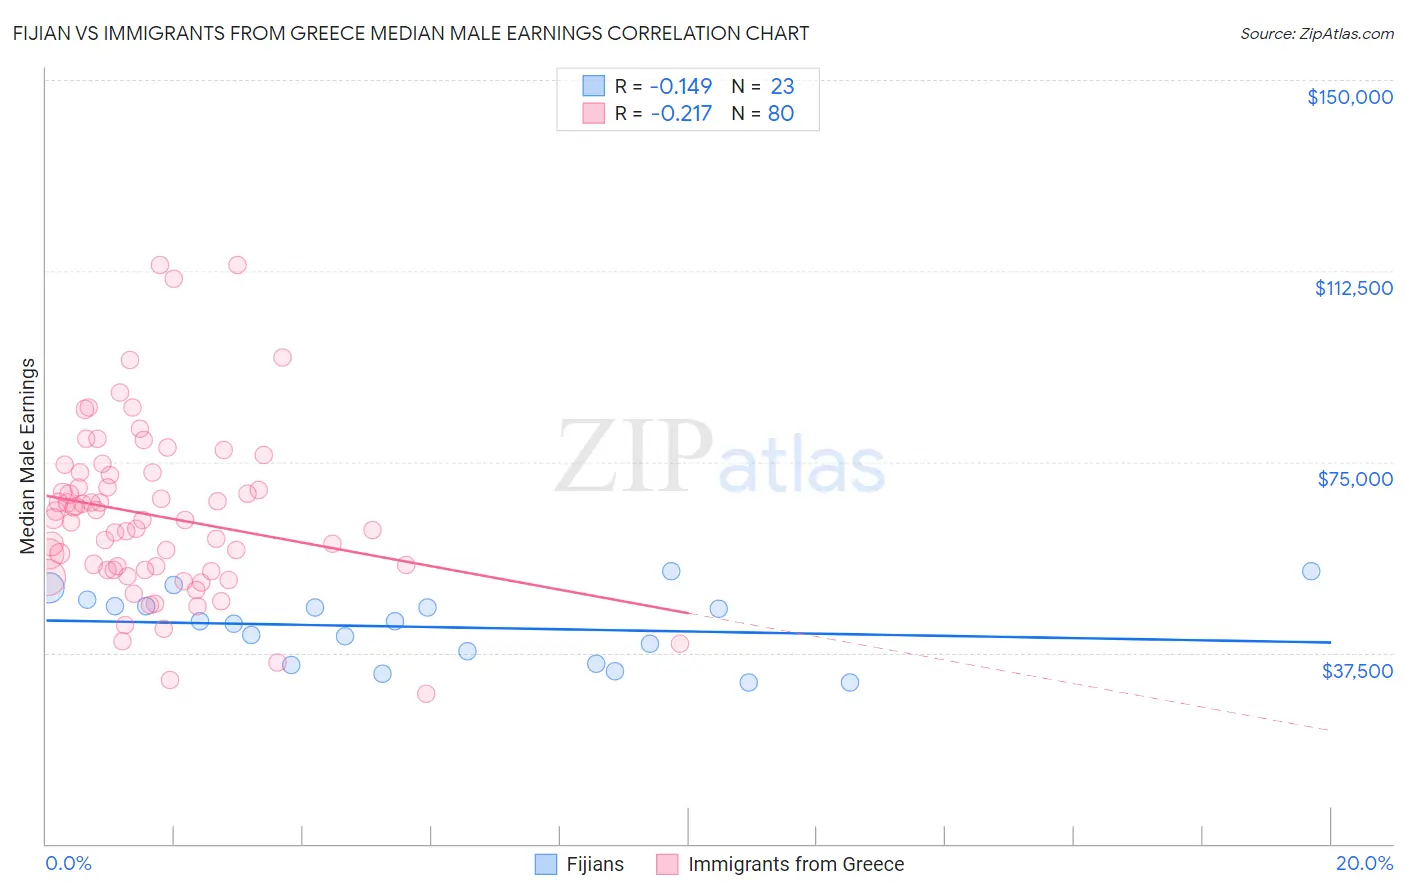
Fijian vs Immigrants from Greece Median Male Earnings Correlation Chart
The statistical analysis conducted on geographies consisting of 55,945,280 people shows a poor negative correlation between the proportion of Fijians and median male earnings in the United States with a correlation coefficient (R) of -0.149 and weighted average of $45,607. Similarly, the statistical analysis conducted on geographies consisting of 216,849,913 people shows a weak negative correlation between the proportion of Immigrants from Greece and median male earnings in the United States with a correlation coefficient (R) of -0.217 and weighted average of $62,689, a difference of 37.4%.
Median Male Earnings Correlation Summary
| Measurement | Fijian | Immigrants from Greece |
| Minimum | $31,736 | $29,414 |
| Maximum | $53,542 | $113,711 |
| Range | $21,806 | $84,297 |
| Mean | $42,546 | $64,375 |
| Median | $43,625 | $63,574 |
| Interquartile 25% (IQ1) | $35,286 | $53,722 |
| Interquartile 75% (IQ3) | $46,656 | $72,600 |
| Interquartile Range (IQR) | $11,370 | $18,879 |
| Standard Deviation (Sample) | $6,788 | $16,629 |
| Standard Deviation (Population) | $6,639 | $16,525 |
Similar Demographics by Median Male Earnings
Demographics Similar to Fijians by Median Male Earnings
In terms of median male earnings, the demographic groups most similar to Fijians are Sioux ($45,566, a difference of 0.090%), Immigrants from Central America ($45,538, a difference of 0.15%), Black/African American ($45,523, a difference of 0.18%), Yuman ($45,446, a difference of 0.35%), and Immigrants from Honduras ($45,787, a difference of 0.39%).
| Demographics | Rating | Rank | Median Male Earnings |
| Chippewa | 0.0 /100 | #314 | Tragic $46,368 |
| Immigrants | Guatemala | 0.0 /100 | #315 | Tragic $46,244 |
| Immigrants | Caribbean | 0.0 /100 | #316 | Tragic $46,193 |
| Mexicans | 0.0 /100 | #317 | Tragic $46,147 |
| Cheyenne | 0.0 /100 | #318 | Tragic $46,062 |
| Haitians | 0.0 /100 | #319 | Tragic $45,903 |
| Immigrants | Honduras | 0.0 /100 | #320 | Tragic $45,787 |
| Fijians | 0.0 /100 | #321 | Tragic $45,607 |
| Sioux | 0.0 /100 | #322 | Tragic $45,566 |
| Immigrants | Central America | 0.0 /100 | #323 | Tragic $45,538 |
| Blacks/African Americans | 0.0 /100 | #324 | Tragic $45,523 |
| Yuman | 0.0 /100 | #325 | Tragic $45,446 |
| Immigrants | Haiti | 0.0 /100 | #326 | Tragic $45,266 |
| Immigrants | Bahamas | 0.0 /100 | #327 | Tragic $45,176 |
| Kiowa | 0.0 /100 | #328 | Tragic $45,094 |
Demographics Similar to Immigrants from Greece by Median Male Earnings
In terms of median male earnings, the demographic groups most similar to Immigrants from Greece are Immigrants from Belarus ($62,658, a difference of 0.050%), Immigrants from Turkey ($62,728, a difference of 0.060%), Australian ($62,857, a difference of 0.27%), Cambodian ($62,516, a difference of 0.28%), and Immigrants from South Africa ($62,899, a difference of 0.34%).
| Demographics | Rating | Rank | Median Male Earnings |
| Immigrants | Asia | 100.0 /100 | #35 | Exceptional $63,240 |
| Israelis | 100.0 /100 | #36 | Exceptional $63,228 |
| Immigrants | Sri Lanka | 100.0 /100 | #37 | Exceptional $63,099 |
| Maltese | 100.0 /100 | #38 | Exceptional $62,953 |
| Immigrants | South Africa | 100.0 /100 | #39 | Exceptional $62,899 |
| Australians | 100.0 /100 | #40 | Exceptional $62,857 |
| Immigrants | Turkey | 100.0 /100 | #41 | Exceptional $62,728 |
| Immigrants | Greece | 100.0 /100 | #42 | Exceptional $62,689 |
| Immigrants | Belarus | 100.0 /100 | #43 | Exceptional $62,658 |
| Cambodians | 100.0 /100 | #44 | Exceptional $62,516 |
| Bulgarians | 100.0 /100 | #45 | Exceptional $62,378 |
| Immigrants | Czechoslovakia | 99.9 /100 | #46 | Exceptional $62,217 |
| Immigrants | Austria | 99.9 /100 | #47 | Exceptional $62,164 |
| Immigrants | Malaysia | 99.9 /100 | #48 | Exceptional $62,121 |
| Immigrants | Europe | 99.9 /100 | #49 | Exceptional $62,057 |