Fijian vs Immigrants from Kazakhstan Median Male Earnings
COMPARE
Fijian
Immigrants from Kazakhstan
Median Male Earnings
Median Male Earnings Comparison
Fijians
Immigrants from Kazakhstan
$45,607
MEDIAN MALE EARNINGS
0.0/ 100
METRIC RATING
321st/ 347
METRIC RANK
$59,278
MEDIAN MALE EARNINGS
99.1/ 100
METRIC RATING
92nd/ 347
METRIC RANK
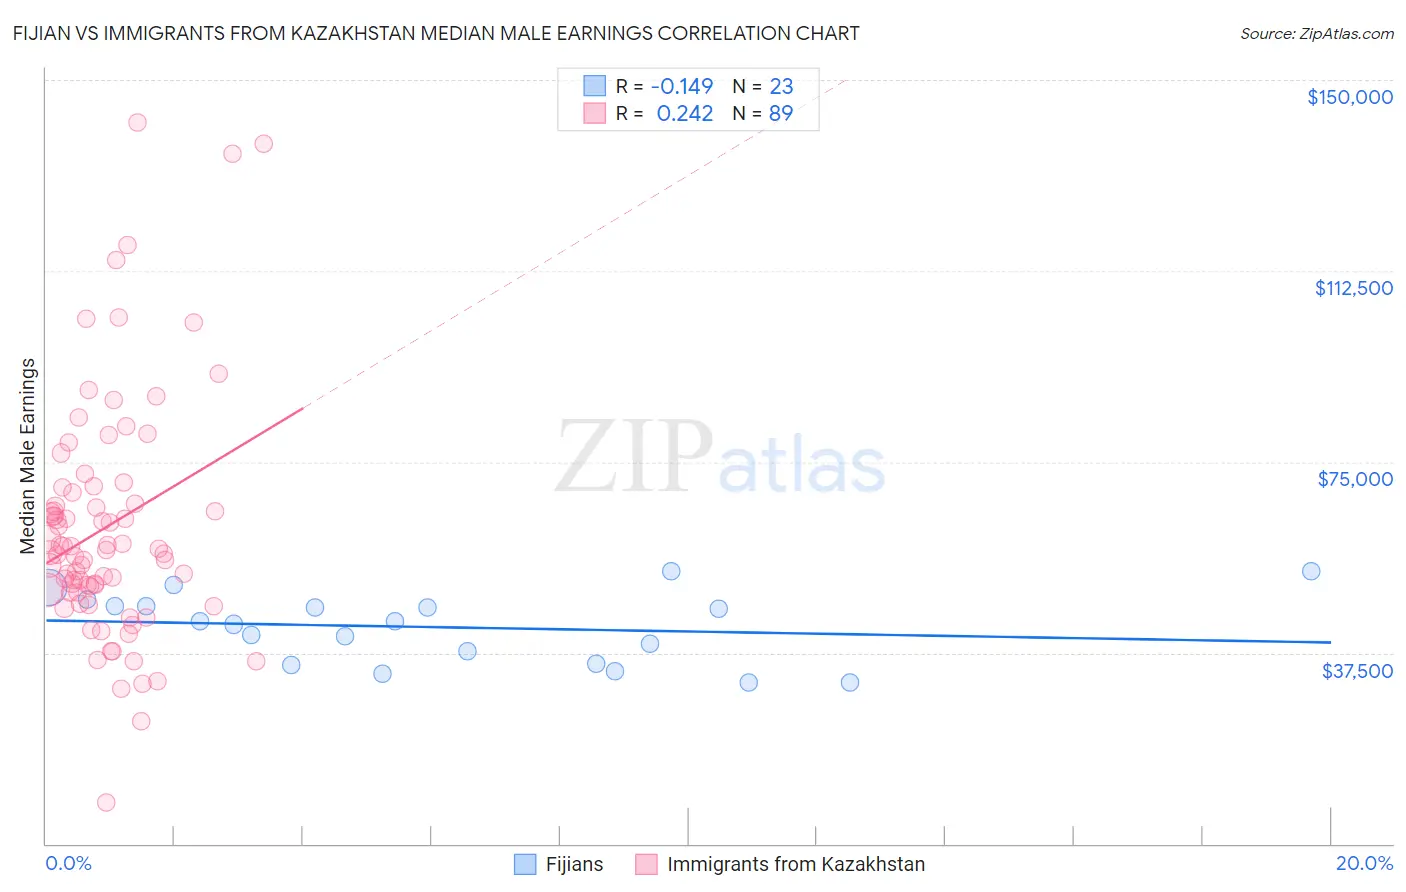
Fijian vs Immigrants from Kazakhstan Median Male Earnings Correlation Chart
The statistical analysis conducted on geographies consisting of 55,945,280 people shows a poor negative correlation between the proportion of Fijians and median male earnings in the United States with a correlation coefficient (R) of -0.149 and weighted average of $45,607. Similarly, the statistical analysis conducted on geographies consisting of 124,430,044 people shows a weak positive correlation between the proportion of Immigrants from Kazakhstan and median male earnings in the United States with a correlation coefficient (R) of 0.242 and weighted average of $59,278, a difference of 30.0%.
Median Male Earnings Correlation Summary
| Measurement | Fijian | Immigrants from Kazakhstan |
| Minimum | $31,736 | $8,214 |
| Maximum | $53,542 | $141,534 |
| Range | $21,806 | $133,320 |
| Mean | $42,546 | $62,279 |
| Median | $43,625 | $57,775 |
| Interquartile 25% (IQ1) | $35,286 | $49,614 |
| Interquartile 75% (IQ3) | $46,656 | $69,378 |
| Interquartile Range (IQR) | $11,370 | $19,764 |
| Standard Deviation (Sample) | $6,788 | $23,727 |
| Standard Deviation (Population) | $6,639 | $23,593 |
Similar Demographics by Median Male Earnings
Demographics Similar to Fijians by Median Male Earnings
In terms of median male earnings, the demographic groups most similar to Fijians are Sioux ($45,566, a difference of 0.090%), Immigrants from Central America ($45,538, a difference of 0.15%), Black/African American ($45,523, a difference of 0.18%), Yuman ($45,446, a difference of 0.35%), and Immigrants from Honduras ($45,787, a difference of 0.39%).
| Demographics | Rating | Rank | Median Male Earnings |
| Chippewa | 0.0 /100 | #314 | Tragic $46,368 |
| Immigrants | Guatemala | 0.0 /100 | #315 | Tragic $46,244 |
| Immigrants | Caribbean | 0.0 /100 | #316 | Tragic $46,193 |
| Mexicans | 0.0 /100 | #317 | Tragic $46,147 |
| Cheyenne | 0.0 /100 | #318 | Tragic $46,062 |
| Haitians | 0.0 /100 | #319 | Tragic $45,903 |
| Immigrants | Honduras | 0.0 /100 | #320 | Tragic $45,787 |
| Fijians | 0.0 /100 | #321 | Tragic $45,607 |
| Sioux | 0.0 /100 | #322 | Tragic $45,566 |
| Immigrants | Central America | 0.0 /100 | #323 | Tragic $45,538 |
| Blacks/African Americans | 0.0 /100 | #324 | Tragic $45,523 |
| Yuman | 0.0 /100 | #325 | Tragic $45,446 |
| Immigrants | Haiti | 0.0 /100 | #326 | Tragic $45,266 |
| Immigrants | Bahamas | 0.0 /100 | #327 | Tragic $45,176 |
| Kiowa | 0.0 /100 | #328 | Tragic $45,094 |
Demographics Similar to Immigrants from Kazakhstan by Median Male Earnings
In terms of median male earnings, the demographic groups most similar to Immigrants from Kazakhstan are Immigrants from Southern Europe ($59,217, a difference of 0.10%), Laotian ($59,351, a difference of 0.12%), Austrian ($59,359, a difference of 0.14%), Immigrants from North Macedonia ($59,189, a difference of 0.15%), and Immigrants from Moldova ($59,417, a difference of 0.24%).
| Demographics | Rating | Rank | Median Male Earnings |
| Italians | 99.3 /100 | #85 | Exceptional $59,551 |
| Immigrants | England | 99.3 /100 | #86 | Exceptional $59,527 |
| Macedonians | 99.3 /100 | #87 | Exceptional $59,522 |
| Immigrants | Argentina | 99.3 /100 | #88 | Exceptional $59,491 |
| Immigrants | Moldova | 99.2 /100 | #89 | Exceptional $59,417 |
| Austrians | 99.2 /100 | #90 | Exceptional $59,359 |
| Laotians | 99.2 /100 | #91 | Exceptional $59,351 |
| Immigrants | Kazakhstan | 99.1 /100 | #92 | Exceptional $59,278 |
| Immigrants | Southern Europe | 99.0 /100 | #93 | Exceptional $59,217 |
| Immigrants | North Macedonia | 99.0 /100 | #94 | Exceptional $59,189 |
| Immigrants | Lebanon | 98.6 /100 | #95 | Exceptional $58,835 |
| Albanians | 98.4 /100 | #96 | Exceptional $58,680 |
| Northern Europeans | 98.2 /100 | #97 | Exceptional $58,588 |
| Jordanians | 98.1 /100 | #98 | Exceptional $58,500 |
| Immigrants | Poland | 98.0 /100 | #99 | Exceptional $58,452 |