Fijian vs Filipino Median Male Earnings
COMPARE
Fijian
Filipino
Median Male Earnings
Median Male Earnings Comparison
Fijians
Filipinos
$45,607
MEDIAN MALE EARNINGS
0.0/ 100
METRIC RATING
321st/ 347
METRIC RANK
$74,224
MEDIAN MALE EARNINGS
100.0/ 100
METRIC RATING
1st/ 347
METRIC RANK
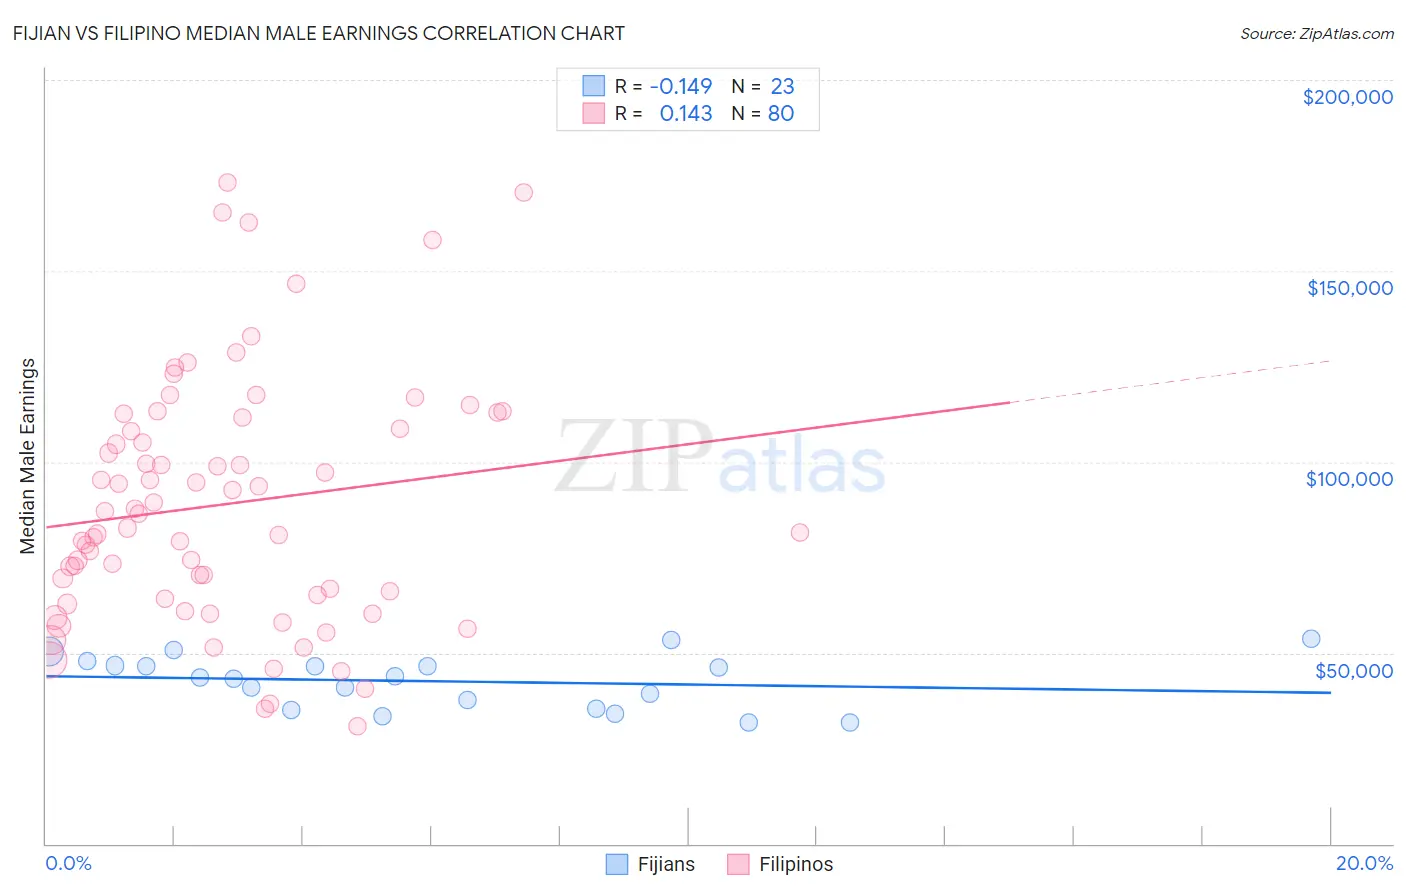
Fijian vs Filipino Median Male Earnings Correlation Chart
The statistical analysis conducted on geographies consisting of 55,945,280 people shows a poor negative correlation between the proportion of Fijians and median male earnings in the United States with a correlation coefficient (R) of -0.149 and weighted average of $45,607. Similarly, the statistical analysis conducted on geographies consisting of 254,342,119 people shows a poor positive correlation between the proportion of Filipinos and median male earnings in the United States with a correlation coefficient (R) of 0.143 and weighted average of $74,224, a difference of 62.7%.
Median Male Earnings Correlation Summary
| Measurement | Fijian | Filipino |
| Minimum | $31,736 | $30,694 |
| Maximum | $53,542 | $173,150 |
| Range | $21,806 | $142,456 |
| Mean | $42,546 | $88,887 |
| Median | $43,625 | $84,592 |
| Interquartile 25% (IQ1) | $35,286 | $64,781 |
| Interquartile 75% (IQ3) | $46,656 | $110,251 |
| Interquartile Range (IQR) | $11,370 | $45,470 |
| Standard Deviation (Sample) | $6,788 | $32,365 |
| Standard Deviation (Population) | $6,639 | $32,162 |
Similar Demographics by Median Male Earnings
Demographics Similar to Fijians by Median Male Earnings
In terms of median male earnings, the demographic groups most similar to Fijians are Sioux ($45,566, a difference of 0.090%), Immigrants from Central America ($45,538, a difference of 0.15%), Black/African American ($45,523, a difference of 0.18%), Yuman ($45,446, a difference of 0.35%), and Immigrants from Honduras ($45,787, a difference of 0.39%).
| Demographics | Rating | Rank | Median Male Earnings |
| Chippewa | 0.0 /100 | #314 | Tragic $46,368 |
| Immigrants | Guatemala | 0.0 /100 | #315 | Tragic $46,244 |
| Immigrants | Caribbean | 0.0 /100 | #316 | Tragic $46,193 |
| Mexicans | 0.0 /100 | #317 | Tragic $46,147 |
| Cheyenne | 0.0 /100 | #318 | Tragic $46,062 |
| Haitians | 0.0 /100 | #319 | Tragic $45,903 |
| Immigrants | Honduras | 0.0 /100 | #320 | Tragic $45,787 |
| Fijians | 0.0 /100 | #321 | Tragic $45,607 |
| Sioux | 0.0 /100 | #322 | Tragic $45,566 |
| Immigrants | Central America | 0.0 /100 | #323 | Tragic $45,538 |
| Blacks/African Americans | 0.0 /100 | #324 | Tragic $45,523 |
| Yuman | 0.0 /100 | #325 | Tragic $45,446 |
| Immigrants | Haiti | 0.0 /100 | #326 | Tragic $45,266 |
| Immigrants | Bahamas | 0.0 /100 | #327 | Tragic $45,176 |
| Kiowa | 0.0 /100 | #328 | Tragic $45,094 |
Demographics Similar to Filipinos by Median Male Earnings
In terms of median male earnings, the demographic groups most similar to Filipinos are Immigrants from India ($74,207, a difference of 0.020%), Immigrants from Taiwan ($74,031, a difference of 0.26%), Thai ($72,135, a difference of 2.9%), Immigrants from Singapore ($71,348, a difference of 4.0%), and Iranian ($70,648, a difference of 5.1%).
| Demographics | Rating | Rank | Median Male Earnings |
| Filipinos | 100.0 /100 | #1 | Exceptional $74,224 |
| Immigrants | India | 100.0 /100 | #2 | Exceptional $74,207 |
| Immigrants | Taiwan | 100.0 /100 | #3 | Exceptional $74,031 |
| Thais | 100.0 /100 | #4 | Exceptional $72,135 |
| Immigrants | Singapore | 100.0 /100 | #5 | Exceptional $71,348 |
| Iranians | 100.0 /100 | #6 | Exceptional $70,648 |
| Immigrants | Hong Kong | 100.0 /100 | #7 | Exceptional $70,146 |
| Immigrants | Iran | 100.0 /100 | #8 | Exceptional $69,284 |
| Immigrants | South Central Asia | 100.0 /100 | #9 | Exceptional $68,960 |
| Immigrants | Israel | 100.0 /100 | #10 | Exceptional $68,716 |
| Immigrants | Ireland | 100.0 /100 | #11 | Exceptional $67,698 |
| Immigrants | Australia | 100.0 /100 | #12 | Exceptional $67,634 |
| Immigrants | China | 100.0 /100 | #13 | Exceptional $67,353 |
| Okinawans | 100.0 /100 | #14 | Exceptional $67,232 |
| Immigrants | Eastern Asia | 100.0 /100 | #15 | Exceptional $66,903 |