Bolivian vs Immigrants from Greece Median Male Earnings
COMPARE
Bolivian
Immigrants from Greece
Median Male Earnings
Median Male Earnings Comparison
Bolivians
Immigrants from Greece
$61,066
MEDIAN MALE EARNINGS
99.8/ 100
METRIC RATING
61st/ 347
METRIC RANK
$62,689
MEDIAN MALE EARNINGS
100.0/ 100
METRIC RATING
42nd/ 347
METRIC RANK
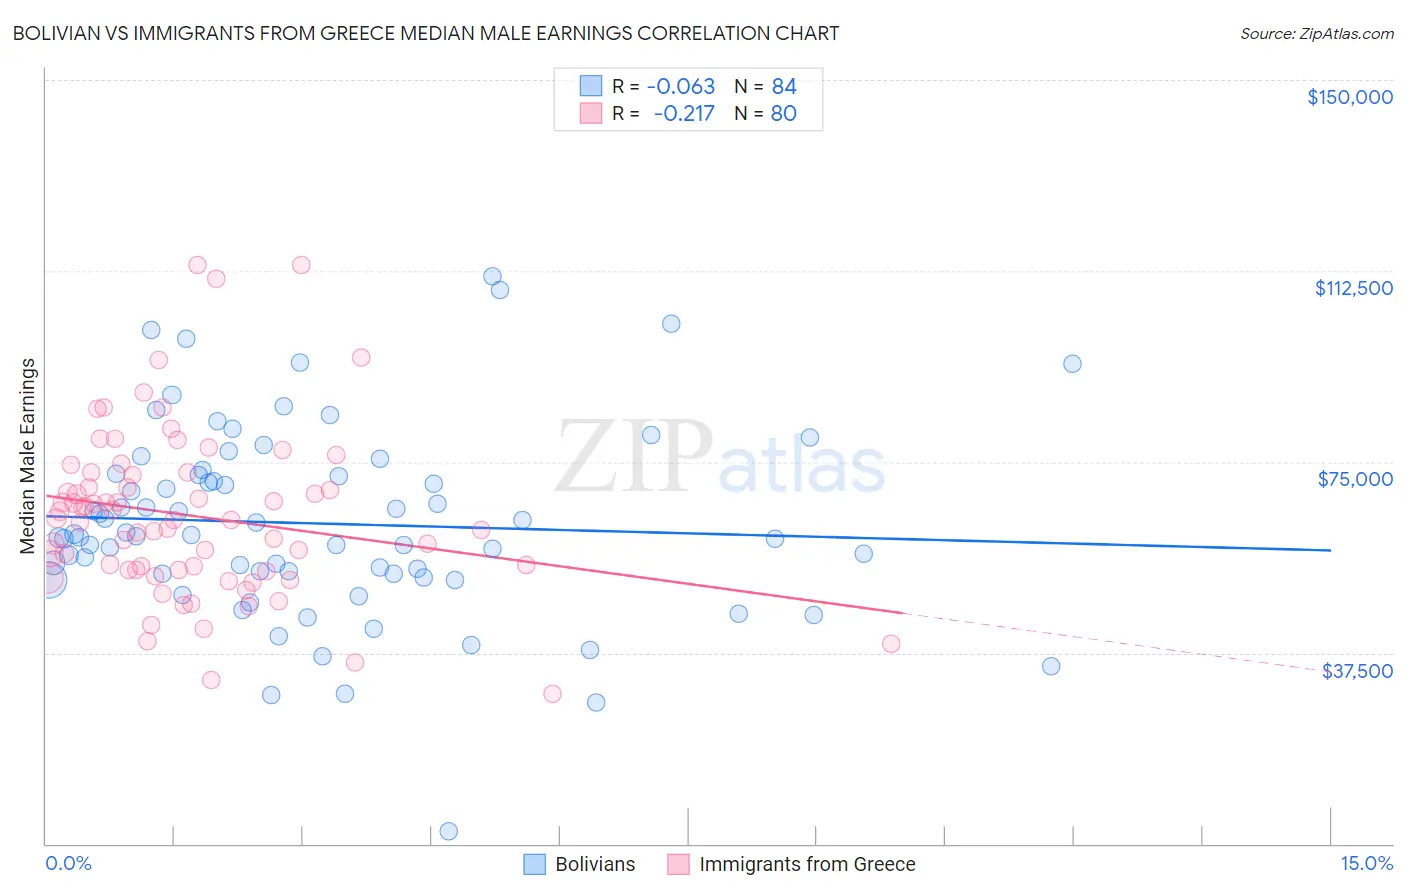
Bolivian vs Immigrants from Greece Median Male Earnings Correlation Chart
The statistical analysis conducted on geographies consisting of 184,669,287 people shows a slight negative correlation between the proportion of Bolivians and median male earnings in the United States with a correlation coefficient (R) of -0.063 and weighted average of $61,066. Similarly, the statistical analysis conducted on geographies consisting of 216,849,913 people shows a weak negative correlation between the proportion of Immigrants from Greece and median male earnings in the United States with a correlation coefficient (R) of -0.217 and weighted average of $62,689, a difference of 2.7%.
Median Male Earnings Correlation Summary
| Measurement | Bolivian | Immigrants from Greece |
| Minimum | $2,499 | $29,414 |
| Maximum | $111,480 | $113,711 |
| Range | $108,981 | $84,297 |
| Mean | $62,895 | $64,375 |
| Median | $60,590 | $63,574 |
| Interquartile 25% (IQ1) | $53,011 | $53,722 |
| Interquartile 75% (IQ3) | $72,615 | $72,600 |
| Interquartile Range (IQR) | $19,604 | $18,879 |
| Standard Deviation (Sample) | $18,921 | $16,629 |
| Standard Deviation (Population) | $18,808 | $16,525 |
Demographics Similar to Bolivians and Immigrants from Greece by Median Male Earnings
In terms of median male earnings, the demographic groups most similar to Bolivians are Immigrants from Netherlands ($61,096, a difference of 0.050%), Egyptian ($61,095, a difference of 0.050%), New Zealander ($61,199, a difference of 0.22%), Immigrants from Scotland ($61,220, a difference of 0.25%), and Lithuanian ($61,228, a difference of 0.27%). Similarly, the demographic groups most similar to Immigrants from Greece are Immigrants from Belarus ($62,658, a difference of 0.050%), Immigrants from Turkey ($62,728, a difference of 0.060%), Cambodian ($62,516, a difference of 0.28%), Bulgarian ($62,378, a difference of 0.50%), and Immigrants from Czechoslovakia ($62,217, a difference of 0.76%).
| Demographics | Rating | Rank | Median Male Earnings |
| Immigrants | Turkey | 100.0 /100 | #41 | Exceptional $62,728 |
| Immigrants | Greece | 100.0 /100 | #42 | Exceptional $62,689 |
| Immigrants | Belarus | 100.0 /100 | #43 | Exceptional $62,658 |
| Cambodians | 100.0 /100 | #44 | Exceptional $62,516 |
| Bulgarians | 100.0 /100 | #45 | Exceptional $62,378 |
| Immigrants | Czechoslovakia | 99.9 /100 | #46 | Exceptional $62,217 |
| Immigrants | Austria | 99.9 /100 | #47 | Exceptional $62,164 |
| Immigrants | Malaysia | 99.9 /100 | #48 | Exceptional $62,121 |
| Immigrants | Europe | 99.9 /100 | #49 | Exceptional $62,057 |
| Bhutanese | 99.9 /100 | #50 | Exceptional $61,759 |
| Estonians | 99.9 /100 | #51 | Exceptional $61,710 |
| Immigrants | Norway | 99.9 /100 | #52 | Exceptional $61,628 |
| South Africans | 99.9 /100 | #53 | Exceptional $61,460 |
| Immigrants | Latvia | 99.9 /100 | #54 | Exceptional $61,422 |
| Greeks | 99.9 /100 | #55 | Exceptional $61,242 |
| Lithuanians | 99.9 /100 | #56 | Exceptional $61,228 |
| Immigrants | Scotland | 99.9 /100 | #57 | Exceptional $61,220 |
| New Zealanders | 99.9 /100 | #58 | Exceptional $61,199 |
| Immigrants | Netherlands | 99.8 /100 | #59 | Exceptional $61,096 |
| Egyptians | 99.8 /100 | #60 | Exceptional $61,095 |
| Bolivians | 99.8 /100 | #61 | Exceptional $61,066 |