Fijian vs Ugandan Median Male Earnings
COMPARE
Fijian
Ugandan
Median Male Earnings
Median Male Earnings Comparison
Fijians
Ugandans
$45,607
MEDIAN MALE EARNINGS
0.0/ 100
METRIC RATING
321st/ 347
METRIC RANK
$55,290
MEDIAN MALE EARNINGS
68.6/ 100
METRIC RATING
163rd/ 347
METRIC RANK
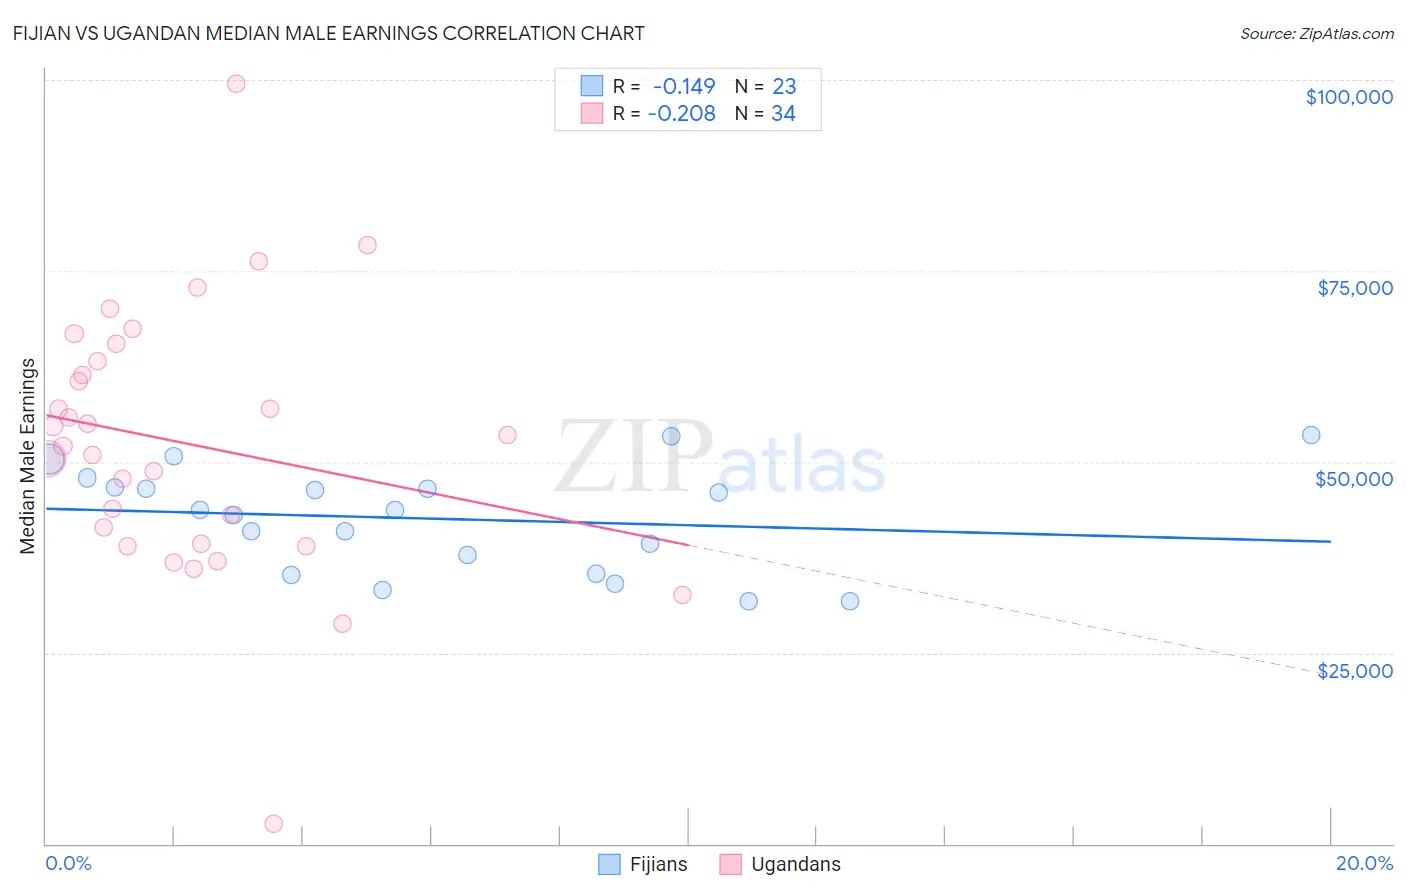
Fijian vs Ugandan Median Male Earnings Correlation Chart
The statistical analysis conducted on geographies consisting of 55,945,280 people shows a poor negative correlation between the proportion of Fijians and median male earnings in the United States with a correlation coefficient (R) of -0.149 and weighted average of $45,607. Similarly, the statistical analysis conducted on geographies consisting of 94,009,031 people shows a weak negative correlation between the proportion of Ugandans and median male earnings in the United States with a correlation coefficient (R) of -0.208 and weighted average of $55,290, a difference of 21.2%.
Median Male Earnings Correlation Summary
| Measurement | Fijian | Ugandan |
| Minimum | $31,736 | $2,614 |
| Maximum | $53,542 | $99,574 |
| Range | $21,806 | $96,960 |
| Mean | $42,546 | $52,480 |
| Median | $43,625 | $52,840 |
| Interquartile 25% (IQ1) | $35,286 | $39,217 |
| Interquartile 75% (IQ3) | $46,656 | $63,193 |
| Interquartile Range (IQR) | $11,370 | $23,975 |
| Standard Deviation (Sample) | $6,788 | $17,547 |
| Standard Deviation (Population) | $6,639 | $17,287 |
Similar Demographics by Median Male Earnings
Demographics Similar to Fijians by Median Male Earnings
In terms of median male earnings, the demographic groups most similar to Fijians are Sioux ($45,566, a difference of 0.090%), Immigrants from Central America ($45,538, a difference of 0.15%), Black/African American ($45,523, a difference of 0.18%), Yuman ($45,446, a difference of 0.35%), and Immigrants from Honduras ($45,787, a difference of 0.39%).
| Demographics | Rating | Rank | Median Male Earnings |
| Chippewa | 0.0 /100 | #314 | Tragic $46,368 |
| Immigrants | Guatemala | 0.0 /100 | #315 | Tragic $46,244 |
| Immigrants | Caribbean | 0.0 /100 | #316 | Tragic $46,193 |
| Mexicans | 0.0 /100 | #317 | Tragic $46,147 |
| Cheyenne | 0.0 /100 | #318 | Tragic $46,062 |
| Haitians | 0.0 /100 | #319 | Tragic $45,903 |
| Immigrants | Honduras | 0.0 /100 | #320 | Tragic $45,787 |
| Fijians | 0.0 /100 | #321 | Tragic $45,607 |
| Sioux | 0.0 /100 | #322 | Tragic $45,566 |
| Immigrants | Central America | 0.0 /100 | #323 | Tragic $45,538 |
| Blacks/African Americans | 0.0 /100 | #324 | Tragic $45,523 |
| Yuman | 0.0 /100 | #325 | Tragic $45,446 |
| Immigrants | Haiti | 0.0 /100 | #326 | Tragic $45,266 |
| Immigrants | Bahamas | 0.0 /100 | #327 | Tragic $45,176 |
| Kiowa | 0.0 /100 | #328 | Tragic $45,094 |
Demographics Similar to Ugandans by Median Male Earnings
In terms of median male earnings, the demographic groups most similar to Ugandans are Immigrants from South Eastern Asia ($55,241, a difference of 0.090%), French ($55,350, a difference of 0.11%), Belgian ($55,361, a difference of 0.13%), Basque ($55,370, a difference of 0.15%), and Alsatian ($55,380, a difference of 0.16%).
| Demographics | Rating | Rank | Median Male Earnings |
| Immigrants | Ethiopia | 71.6 /100 | #156 | Good $55,434 |
| Icelanders | 71.2 /100 | #157 | Good $55,415 |
| Czechoslovakians | 70.5 /100 | #158 | Good $55,382 |
| Alsatians | 70.5 /100 | #159 | Good $55,380 |
| Basques | 70.3 /100 | #160 | Good $55,370 |
| Belgians | 70.1 /100 | #161 | Good $55,361 |
| French | 69.9 /100 | #162 | Good $55,350 |
| Ugandans | 68.6 /100 | #163 | Good $55,290 |
| Immigrants | South Eastern Asia | 67.6 /100 | #164 | Good $55,241 |
| Immigrants | Portugal | 66.3 /100 | #165 | Good $55,182 |
| Germans | 61.6 /100 | #166 | Good $54,974 |
| Immigrants | Fiji | 61.2 /100 | #167 | Good $54,958 |
| Immigrants | Vietnam | 60.2 /100 | #168 | Good $54,913 |
| French Canadians | 55.6 /100 | #169 | Average $54,722 |
| Finns | 55.6 /100 | #170 | Average $54,721 |