Fijian vs Trinidadian and Tobagonian Median Male Earnings
COMPARE
Fijian
Trinidadian and Tobagonian
Median Male Earnings
Median Male Earnings Comparison
Fijians
Trinidadians and Tobagonians
$45,607
MEDIAN MALE EARNINGS
0.0/ 100
METRIC RATING
321st/ 347
METRIC RANK
$51,446
MEDIAN MALE EARNINGS
4.8/ 100
METRIC RATING
227th/ 347
METRIC RANK
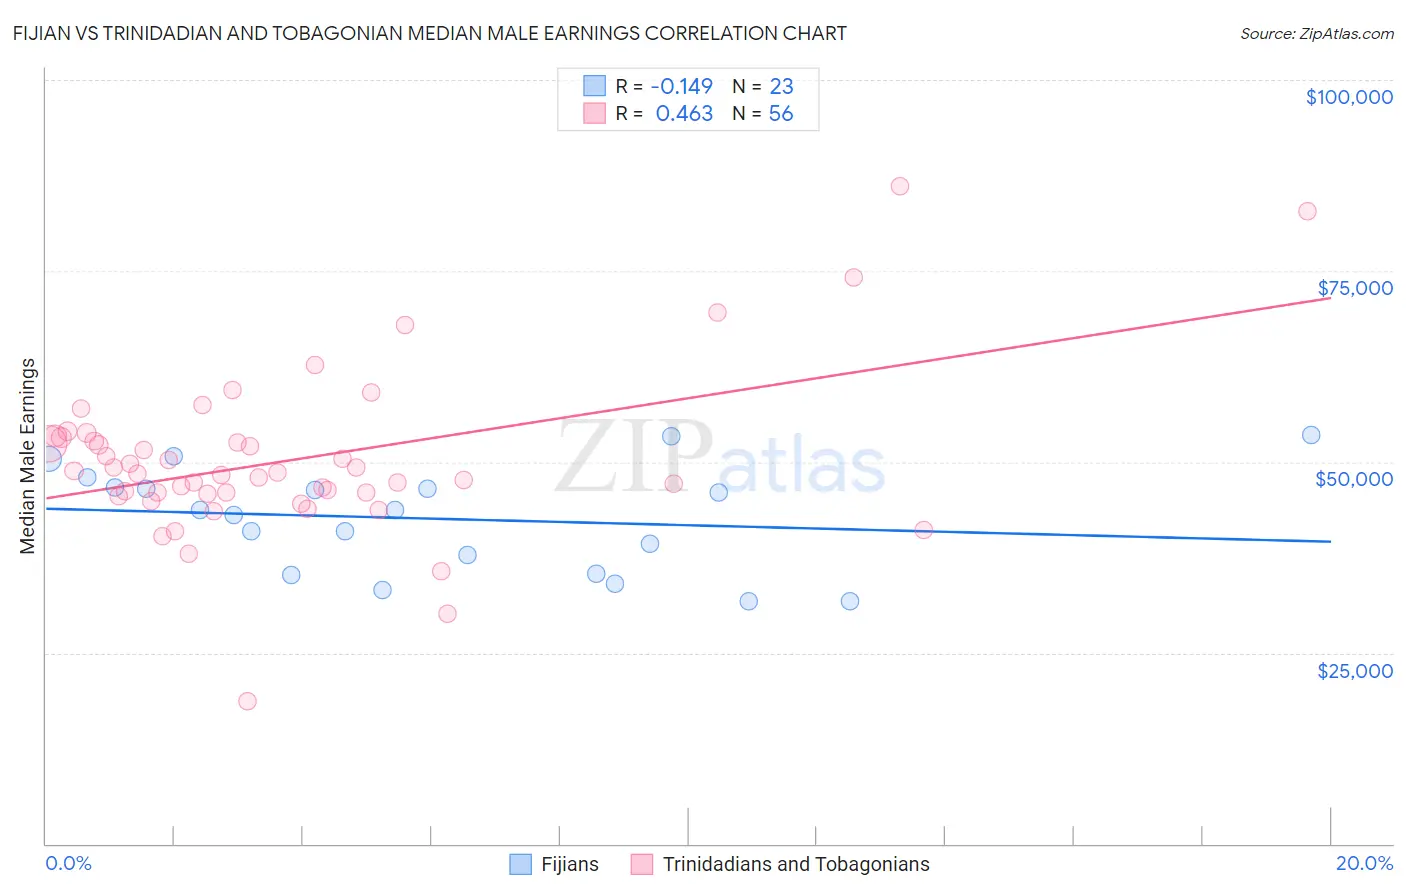
Fijian vs Trinidadian and Tobagonian Median Male Earnings Correlation Chart
The statistical analysis conducted on geographies consisting of 55,945,280 people shows a poor negative correlation between the proportion of Fijians and median male earnings in the United States with a correlation coefficient (R) of -0.149 and weighted average of $45,607. Similarly, the statistical analysis conducted on geographies consisting of 219,852,286 people shows a moderate positive correlation between the proportion of Trinidadians and Tobagonians and median male earnings in the United States with a correlation coefficient (R) of 0.463 and weighted average of $51,446, a difference of 12.8%.
Median Male Earnings Correlation Summary
| Measurement | Fijian | Trinidadian and Tobagonian |
| Minimum | $31,736 | $18,666 |
| Maximum | $53,542 | $86,046 |
| Range | $21,806 | $67,380 |
| Mean | $42,546 | $50,279 |
| Median | $43,625 | $48,562 |
| Interquartile 25% (IQ1) | $35,286 | $45,885 |
| Interquartile 75% (IQ3) | $46,656 | $52,942 |
| Interquartile Range (IQR) | $11,370 | $7,058 |
| Standard Deviation (Sample) | $6,788 | $10,888 |
| Standard Deviation (Population) | $6,639 | $10,790 |
Similar Demographics by Median Male Earnings
Demographics Similar to Fijians by Median Male Earnings
In terms of median male earnings, the demographic groups most similar to Fijians are Sioux ($45,566, a difference of 0.090%), Immigrants from Central America ($45,538, a difference of 0.15%), Black/African American ($45,523, a difference of 0.18%), Yuman ($45,446, a difference of 0.35%), and Immigrants from Honduras ($45,787, a difference of 0.39%).
| Demographics | Rating | Rank | Median Male Earnings |
| Chippewa | 0.0 /100 | #314 | Tragic $46,368 |
| Immigrants | Guatemala | 0.0 /100 | #315 | Tragic $46,244 |
| Immigrants | Caribbean | 0.0 /100 | #316 | Tragic $46,193 |
| Mexicans | 0.0 /100 | #317 | Tragic $46,147 |
| Cheyenne | 0.0 /100 | #318 | Tragic $46,062 |
| Haitians | 0.0 /100 | #319 | Tragic $45,903 |
| Immigrants | Honduras | 0.0 /100 | #320 | Tragic $45,787 |
| Fijians | 0.0 /100 | #321 | Tragic $45,607 |
| Sioux | 0.0 /100 | #322 | Tragic $45,566 |
| Immigrants | Central America | 0.0 /100 | #323 | Tragic $45,538 |
| Blacks/African Americans | 0.0 /100 | #324 | Tragic $45,523 |
| Yuman | 0.0 /100 | #325 | Tragic $45,446 |
| Immigrants | Haiti | 0.0 /100 | #326 | Tragic $45,266 |
| Immigrants | Bahamas | 0.0 /100 | #327 | Tragic $45,176 |
| Kiowa | 0.0 /100 | #328 | Tragic $45,094 |
Demographics Similar to Trinidadians and Tobagonians by Median Male Earnings
In terms of median male earnings, the demographic groups most similar to Trinidadians and Tobagonians are Japanese ($51,473, a difference of 0.050%), Immigrants from Sudan ($51,489, a difference of 0.080%), Samoan ($51,389, a difference of 0.11%), Immigrants from Trinidad and Tobago ($51,376, a difference of 0.14%), and Immigrants from Nigeria ($51,310, a difference of 0.27%).
| Demographics | Rating | Rank | Median Male Earnings |
| Immigrants | Armenia | 6.6 /100 | #220 | Tragic $51,793 |
| Immigrants | Senegal | 5.8 /100 | #221 | Tragic $51,647 |
| Immigrants | Bangladesh | 5.8 /100 | #222 | Tragic $51,642 |
| Ecuadorians | 5.5 /100 | #223 | Tragic $51,596 |
| Immigrants | Cambodia | 5.5 /100 | #224 | Tragic $51,594 |
| Immigrants | Sudan | 5.0 /100 | #225 | Tragic $51,489 |
| Japanese | 4.9 /100 | #226 | Tragic $51,473 |
| Trinidadians and Tobagonians | 4.8 /100 | #227 | Tragic $51,446 |
| Samoans | 4.6 /100 | #228 | Tragic $51,389 |
| Immigrants | Trinidad and Tobago | 4.5 /100 | #229 | Tragic $51,376 |
| Immigrants | Nigeria | 4.2 /100 | #230 | Tragic $51,310 |
| Barbadians | 3.9 /100 | #231 | Tragic $51,236 |
| Sudanese | 3.9 /100 | #232 | Tragic $51,216 |
| Aleuts | 3.7 /100 | #233 | Tragic $51,168 |
| Cape Verdeans | 3.5 /100 | #234 | Tragic $51,103 |