Fijian vs Immigrants from Belgium Median Male Earnings
COMPARE
Fijian
Immigrants from Belgium
Median Male Earnings
Median Male Earnings Comparison
Fijians
Immigrants from Belgium
$45,607
MEDIAN MALE EARNINGS
0.0/ 100
METRIC RATING
321st/ 347
METRIC RANK
$66,125
MEDIAN MALE EARNINGS
100.0/ 100
METRIC RATING
17th/ 347
METRIC RANK
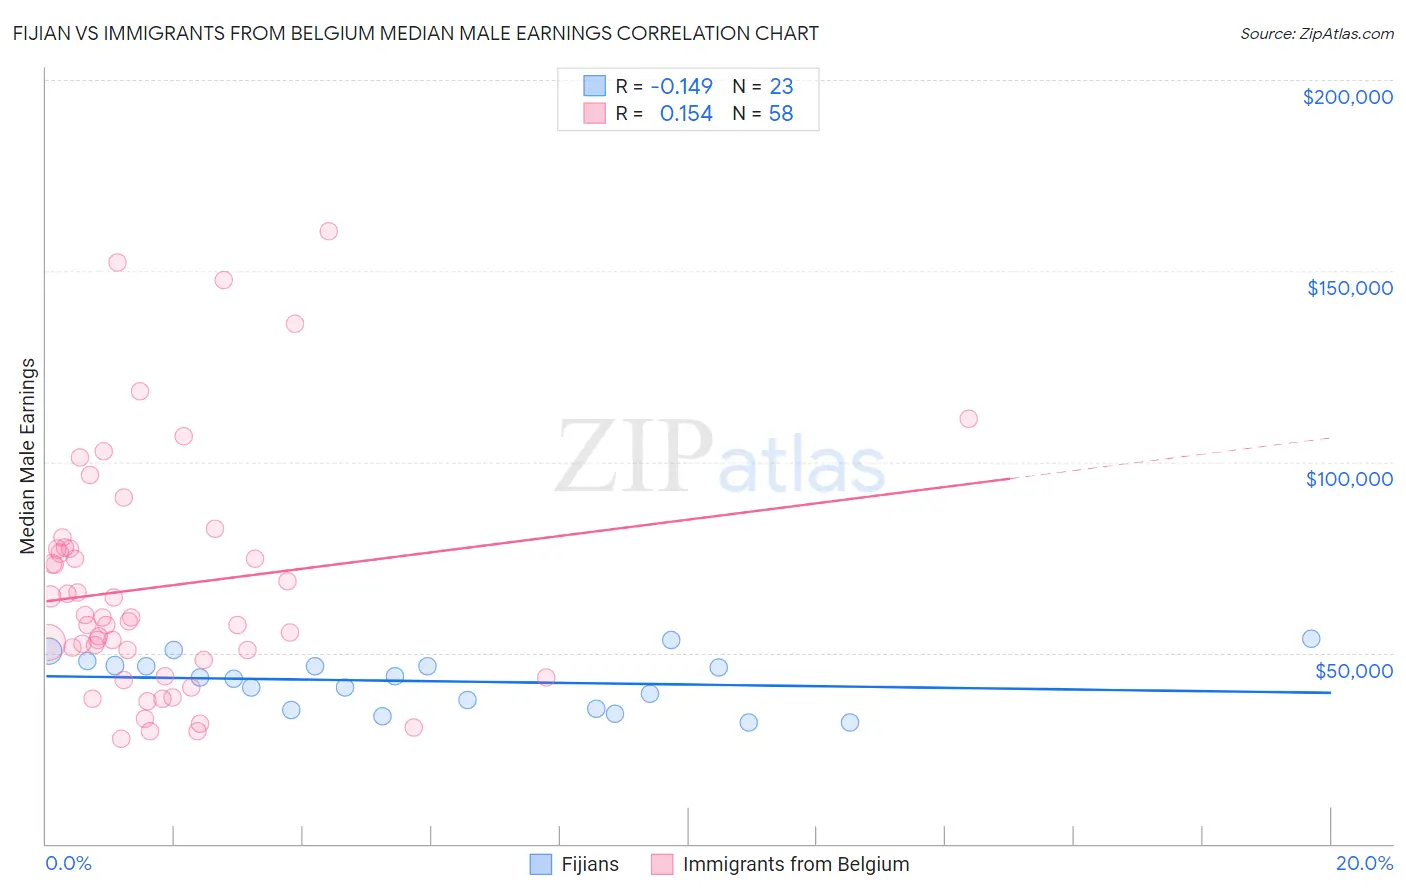
Fijian vs Immigrants from Belgium Median Male Earnings Correlation Chart
The statistical analysis conducted on geographies consisting of 55,945,280 people shows a poor negative correlation between the proportion of Fijians and median male earnings in the United States with a correlation coefficient (R) of -0.149 and weighted average of $45,607. Similarly, the statistical analysis conducted on geographies consisting of 146,683,317 people shows a poor positive correlation between the proportion of Immigrants from Belgium and median male earnings in the United States with a correlation coefficient (R) of 0.154 and weighted average of $66,125, a difference of 45.0%.
Median Male Earnings Correlation Summary
| Measurement | Fijian | Immigrants from Belgium |
| Minimum | $31,736 | $27,540 |
| Maximum | $53,542 | $160,536 |
| Range | $21,806 | $132,996 |
| Mean | $42,546 | $67,352 |
| Median | $43,625 | $58,812 |
| Interquartile 25% (IQ1) | $35,286 | $48,036 |
| Interquartile 75% (IQ3) | $46,656 | $77,202 |
| Interquartile Range (IQR) | $11,370 | $29,166 |
| Standard Deviation (Sample) | $6,788 | $31,129 |
| Standard Deviation (Population) | $6,639 | $30,859 |
Similar Demographics by Median Male Earnings
Demographics Similar to Fijians by Median Male Earnings
In terms of median male earnings, the demographic groups most similar to Fijians are Sioux ($45,566, a difference of 0.090%), Immigrants from Central America ($45,538, a difference of 0.15%), Black/African American ($45,523, a difference of 0.18%), Yuman ($45,446, a difference of 0.35%), and Immigrants from Honduras ($45,787, a difference of 0.39%).
| Demographics | Rating | Rank | Median Male Earnings |
| Chippewa | 0.0 /100 | #314 | Tragic $46,368 |
| Immigrants | Guatemala | 0.0 /100 | #315 | Tragic $46,244 |
| Immigrants | Caribbean | 0.0 /100 | #316 | Tragic $46,193 |
| Mexicans | 0.0 /100 | #317 | Tragic $46,147 |
| Cheyenne | 0.0 /100 | #318 | Tragic $46,062 |
| Haitians | 0.0 /100 | #319 | Tragic $45,903 |
| Immigrants | Honduras | 0.0 /100 | #320 | Tragic $45,787 |
| Fijians | 0.0 /100 | #321 | Tragic $45,607 |
| Sioux | 0.0 /100 | #322 | Tragic $45,566 |
| Immigrants | Central America | 0.0 /100 | #323 | Tragic $45,538 |
| Blacks/African Americans | 0.0 /100 | #324 | Tragic $45,523 |
| Yuman | 0.0 /100 | #325 | Tragic $45,446 |
| Immigrants | Haiti | 0.0 /100 | #326 | Tragic $45,266 |
| Immigrants | Bahamas | 0.0 /100 | #327 | Tragic $45,176 |
| Kiowa | 0.0 /100 | #328 | Tragic $45,094 |
Demographics Similar to Immigrants from Belgium by Median Male Earnings
In terms of median male earnings, the demographic groups most similar to Immigrants from Belgium are Indian (Asian) ($66,078, a difference of 0.070%), Eastern European ($66,472, a difference of 0.53%), Cypriot ($65,549, a difference of 0.88%), Immigrants from Japan ($65,518, a difference of 0.93%), and Immigrants from Sweden ($65,406, a difference of 1.1%).
| Demographics | Rating | Rank | Median Male Earnings |
| Immigrants | Israel | 100.0 /100 | #10 | Exceptional $68,716 |
| Immigrants | Ireland | 100.0 /100 | #11 | Exceptional $67,698 |
| Immigrants | Australia | 100.0 /100 | #12 | Exceptional $67,634 |
| Immigrants | China | 100.0 /100 | #13 | Exceptional $67,353 |
| Okinawans | 100.0 /100 | #14 | Exceptional $67,232 |
| Immigrants | Eastern Asia | 100.0 /100 | #15 | Exceptional $66,903 |
| Eastern Europeans | 100.0 /100 | #16 | Exceptional $66,472 |
| Immigrants | Belgium | 100.0 /100 | #17 | Exceptional $66,125 |
| Indians (Asian) | 100.0 /100 | #18 | Exceptional $66,078 |
| Cypriots | 100.0 /100 | #19 | Exceptional $65,549 |
| Immigrants | Japan | 100.0 /100 | #20 | Exceptional $65,518 |
| Immigrants | Sweden | 100.0 /100 | #21 | Exceptional $65,406 |
| Burmese | 100.0 /100 | #22 | Exceptional $65,236 |
| Immigrants | Korea | 100.0 /100 | #23 | Exceptional $65,079 |
| Immigrants | Northern Europe | 100.0 /100 | #24 | Exceptional $64,987 |