Burmese vs Immigrants from Greece Median Male Earnings
COMPARE
Burmese
Immigrants from Greece
Median Male Earnings
Median Male Earnings Comparison
Burmese
Immigrants from Greece
$65,236
MEDIAN MALE EARNINGS
100.0/ 100
METRIC RATING
22nd/ 347
METRIC RANK
$62,689
MEDIAN MALE EARNINGS
100.0/ 100
METRIC RATING
42nd/ 347
METRIC RANK
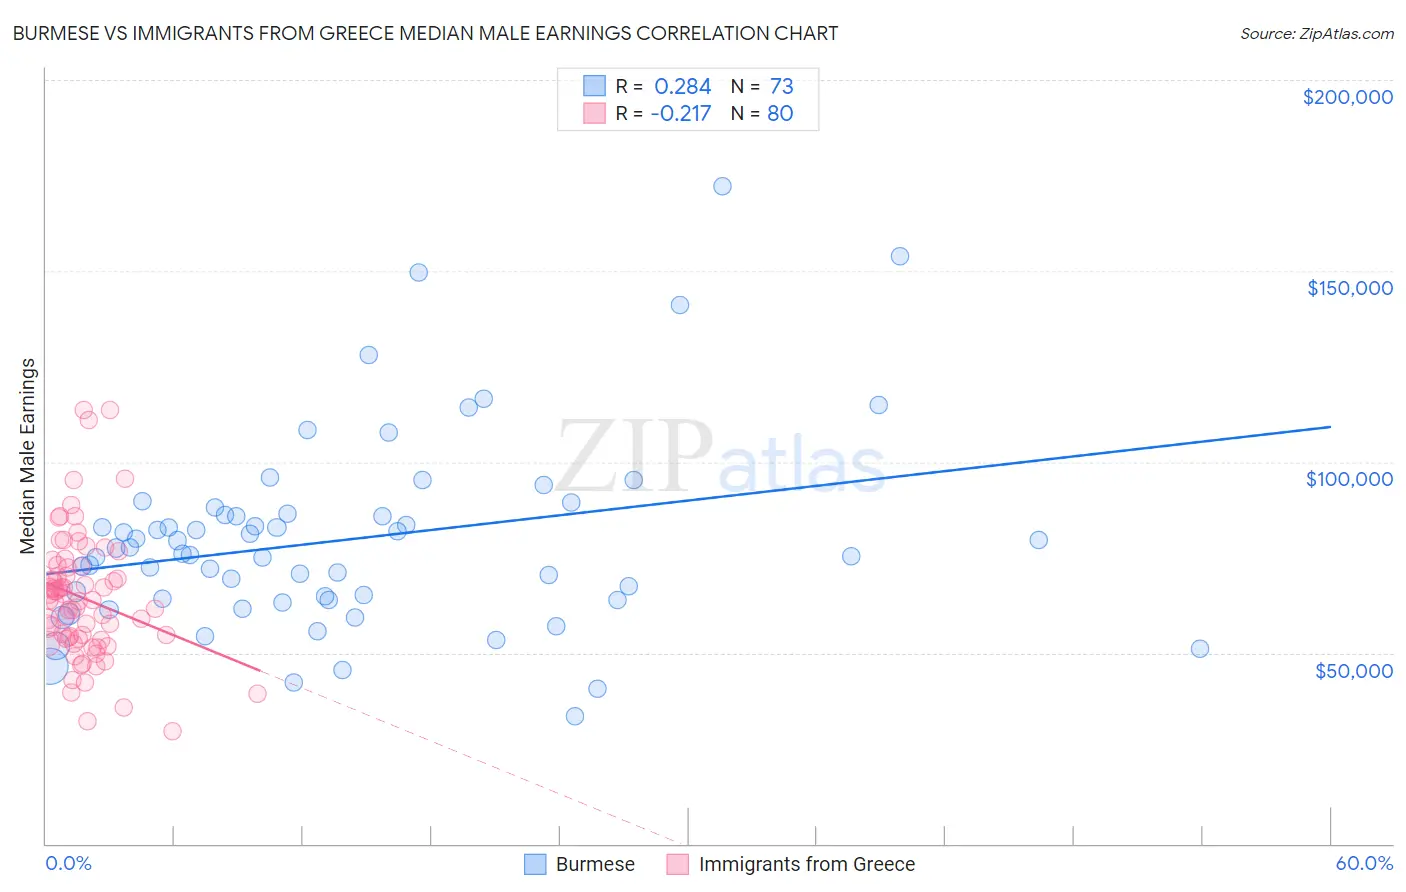
Burmese vs Immigrants from Greece Median Male Earnings Correlation Chart
The statistical analysis conducted on geographies consisting of 465,224,564 people shows a weak positive correlation between the proportion of Burmese and median male earnings in the United States with a correlation coefficient (R) of 0.284 and weighted average of $65,236. Similarly, the statistical analysis conducted on geographies consisting of 216,849,913 people shows a weak negative correlation between the proportion of Immigrants from Greece and median male earnings in the United States with a correlation coefficient (R) of -0.217 and weighted average of $62,689, a difference of 4.1%.
Median Male Earnings Correlation Summary
| Measurement | Burmese | Immigrants from Greece |
| Minimum | $33,399 | $29,414 |
| Maximum | $172,143 | $113,711 |
| Range | $138,744 | $84,297 |
| Mean | $79,644 | $64,375 |
| Median | $75,943 | $63,574 |
| Interquartile 25% (IQ1) | $63,717 | $53,722 |
| Interquartile 75% (IQ3) | $86,383 | $72,600 |
| Interquartile Range (IQR) | $22,666 | $18,879 |
| Standard Deviation (Sample) | $25,713 | $16,629 |
| Standard Deviation (Population) | $25,536 | $16,525 |
Demographics Similar to Burmese and Immigrants from Greece by Median Male Earnings
In terms of median male earnings, the demographic groups most similar to Burmese are Immigrants from Korea ($65,079, a difference of 0.24%), Immigrants from Northern Europe ($64,987, a difference of 0.38%), Immigrants from Denmark ($64,625, a difference of 0.95%), Turkish ($64,253, a difference of 1.5%), and Immigrants from Switzerland ($63,944, a difference of 2.0%). Similarly, the demographic groups most similar to Immigrants from Greece are Immigrants from Turkey ($62,728, a difference of 0.060%), Australian ($62,857, a difference of 0.27%), Immigrants from South Africa ($62,899, a difference of 0.34%), Maltese ($62,953, a difference of 0.42%), and Immigrants from Sri Lanka ($63,099, a difference of 0.65%).
| Demographics | Rating | Rank | Median Male Earnings |
| Burmese | 100.0 /100 | #22 | Exceptional $65,236 |
| Immigrants | Korea | 100.0 /100 | #23 | Exceptional $65,079 |
| Immigrants | Northern Europe | 100.0 /100 | #24 | Exceptional $64,987 |
| Immigrants | Denmark | 100.0 /100 | #25 | Exceptional $64,625 |
| Turks | 100.0 /100 | #26 | Exceptional $64,253 |
| Immigrants | Switzerland | 100.0 /100 | #27 | Exceptional $63,944 |
| Russians | 100.0 /100 | #28 | Exceptional $63,939 |
| Asians | 100.0 /100 | #29 | Exceptional $63,827 |
| Immigrants | France | 100.0 /100 | #30 | Exceptional $63,715 |
| Latvians | 100.0 /100 | #31 | Exceptional $63,498 |
| Soviet Union | 100.0 /100 | #32 | Exceptional $63,382 |
| Immigrants | Lithuania | 100.0 /100 | #33 | Exceptional $63,346 |
| Immigrants | Russia | 100.0 /100 | #34 | Exceptional $63,326 |
| Immigrants | Asia | 100.0 /100 | #35 | Exceptional $63,240 |
| Israelis | 100.0 /100 | #36 | Exceptional $63,228 |
| Immigrants | Sri Lanka | 100.0 /100 | #37 | Exceptional $63,099 |
| Maltese | 100.0 /100 | #38 | Exceptional $62,953 |
| Immigrants | South Africa | 100.0 /100 | #39 | Exceptional $62,899 |
| Australians | 100.0 /100 | #40 | Exceptional $62,857 |
| Immigrants | Turkey | 100.0 /100 | #41 | Exceptional $62,728 |
| Immigrants | Greece | 100.0 /100 | #42 | Exceptional $62,689 |