Liberian vs Filipino Median Male Earnings
COMPARE
Liberian
Filipino
Median Male Earnings
Median Male Earnings Comparison
Liberians
Filipinos
$49,318
MEDIAN MALE EARNINGS
0.6/ 100
METRIC RATING
261st/ 347
METRIC RANK
$74,224
MEDIAN MALE EARNINGS
100.0/ 100
METRIC RATING
1st/ 347
METRIC RANK
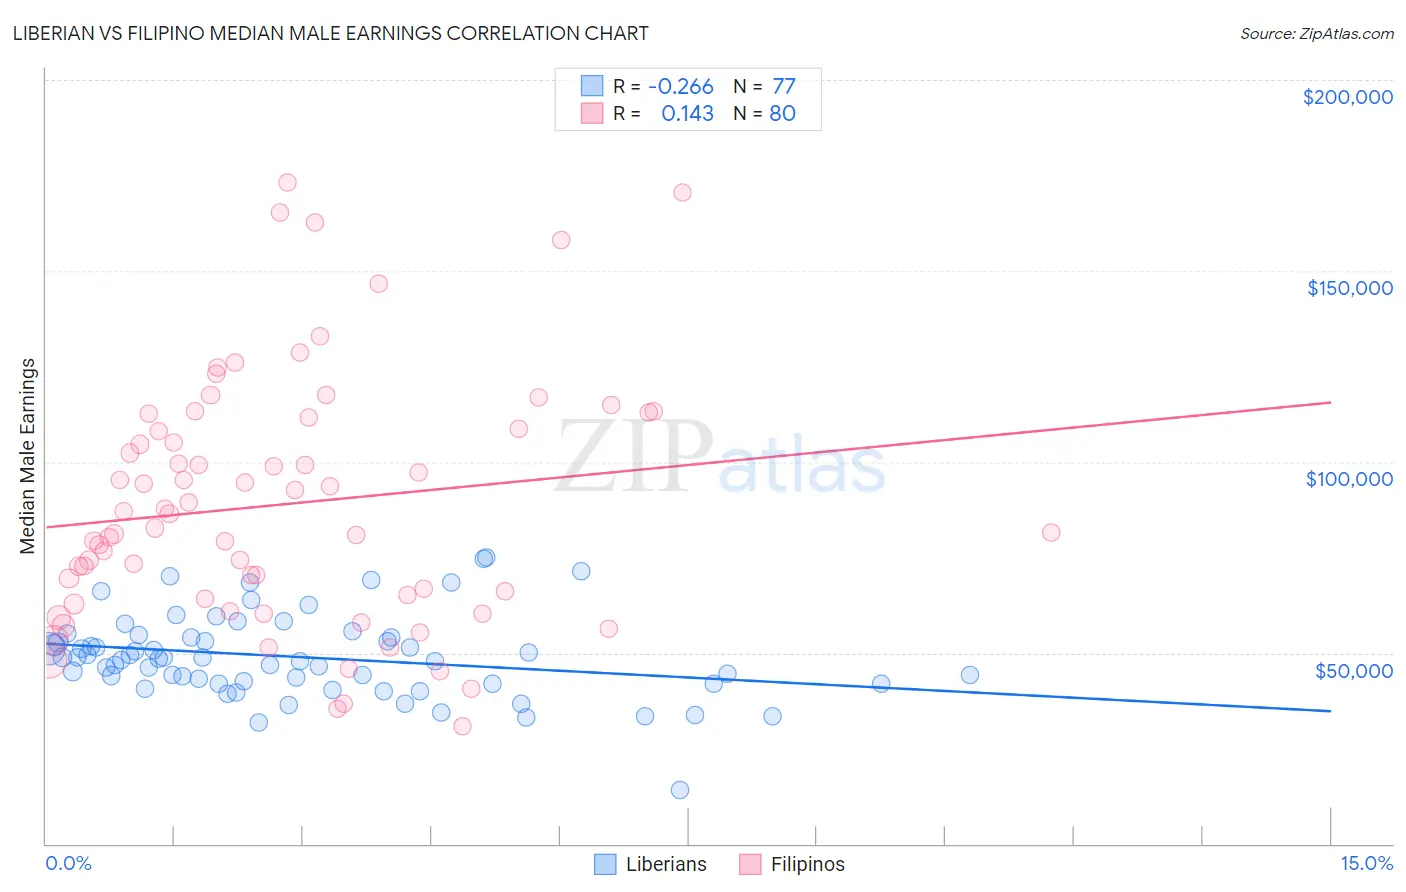
Liberian vs Filipino Median Male Earnings Correlation Chart
The statistical analysis conducted on geographies consisting of 118,095,267 people shows a weak negative correlation between the proportion of Liberians and median male earnings in the United States with a correlation coefficient (R) of -0.266 and weighted average of $49,318. Similarly, the statistical analysis conducted on geographies consisting of 254,342,119 people shows a poor positive correlation between the proportion of Filipinos and median male earnings in the United States with a correlation coefficient (R) of 0.143 and weighted average of $74,224, a difference of 50.5%.
Median Male Earnings Correlation Summary
| Measurement | Liberian | Filipino |
| Minimum | $14,075 | $30,694 |
| Maximum | $74,924 | $173,150 |
| Range | $60,849 | $142,456 |
| Mean | $48,884 | $88,887 |
| Median | $48,498 | $84,592 |
| Interquartile 25% (IQ1) | $41,872 | $64,781 |
| Interquartile 75% (IQ3) | $54,038 | $110,251 |
| Interquartile Range (IQR) | $12,166 | $45,470 |
| Standard Deviation (Sample) | $10,904 | $32,365 |
| Standard Deviation (Population) | $10,833 | $32,162 |
Similar Demographics by Median Male Earnings
Demographics Similar to Liberians by Median Male Earnings
In terms of median male earnings, the demographic groups most similar to Liberians are Immigrants from West Indies ($49,271, a difference of 0.10%), Iroquois ($49,374, a difference of 0.11%), Nicaraguan ($49,215, a difference of 0.21%), Immigrants from Middle Africa ($49,201, a difference of 0.24%), and Immigrants from Laos ($49,190, a difference of 0.26%).
| Demographics | Rating | Rank | Median Male Earnings |
| Senegalese | 1.0 /100 | #254 | Tragic $49,774 |
| Alaskan Athabascans | 0.9 /100 | #255 | Tragic $49,748 |
| Alaska Natives | 0.9 /100 | #256 | Tragic $49,711 |
| British West Indians | 0.8 /100 | #257 | Tragic $49,636 |
| Cree | 0.7 /100 | #258 | Tragic $49,497 |
| Nepalese | 0.7 /100 | #259 | Tragic $49,458 |
| Iroquois | 0.7 /100 | #260 | Tragic $49,374 |
| Liberians | 0.6 /100 | #261 | Tragic $49,318 |
| Immigrants | West Indies | 0.6 /100 | #262 | Tragic $49,271 |
| Nicaraguans | 0.6 /100 | #263 | Tragic $49,215 |
| Immigrants | Middle Africa | 0.6 /100 | #264 | Tragic $49,201 |
| Immigrants | Laos | 0.6 /100 | #265 | Tragic $49,190 |
| Somalis | 0.5 /100 | #266 | Tragic $49,025 |
| Spanish Americans | 0.5 /100 | #267 | Tragic $49,008 |
| Ute | 0.4 /100 | #268 | Tragic $48,899 |
Demographics Similar to Filipinos by Median Male Earnings
In terms of median male earnings, the demographic groups most similar to Filipinos are Immigrants from India ($74,207, a difference of 0.020%), Immigrants from Taiwan ($74,031, a difference of 0.26%), Thai ($72,135, a difference of 2.9%), Immigrants from Singapore ($71,348, a difference of 4.0%), and Iranian ($70,648, a difference of 5.1%).
| Demographics | Rating | Rank | Median Male Earnings |
| Filipinos | 100.0 /100 | #1 | Exceptional $74,224 |
| Immigrants | India | 100.0 /100 | #2 | Exceptional $74,207 |
| Immigrants | Taiwan | 100.0 /100 | #3 | Exceptional $74,031 |
| Thais | 100.0 /100 | #4 | Exceptional $72,135 |
| Immigrants | Singapore | 100.0 /100 | #5 | Exceptional $71,348 |
| Iranians | 100.0 /100 | #6 | Exceptional $70,648 |
| Immigrants | Hong Kong | 100.0 /100 | #7 | Exceptional $70,146 |
| Immigrants | Iran | 100.0 /100 | #8 | Exceptional $69,284 |
| Immigrants | South Central Asia | 100.0 /100 | #9 | Exceptional $68,960 |
| Immigrants | Israel | 100.0 /100 | #10 | Exceptional $68,716 |
| Immigrants | Ireland | 100.0 /100 | #11 | Exceptional $67,698 |
| Immigrants | Australia | 100.0 /100 | #12 | Exceptional $67,634 |
| Immigrants | China | 100.0 /100 | #13 | Exceptional $67,353 |
| Okinawans | 100.0 /100 | #14 | Exceptional $67,232 |
| Immigrants | Eastern Asia | 100.0 /100 | #15 | Exceptional $66,903 |