Ghanaian vs Filipino Median Male Earnings

COMPARE

Ghanaian
Race
Ancestry
AfghanAfricanAlaska NativeAlaskan AthabascanAlbanianAleutAlsatianAmericanApacheArabArapahoArgentineanArmenianAssyrian/Chaldean/SyriacAustralianAustrianBahamianBangladeshiBarbadianBasqueBelgianBelizeanBermudanBhutaneseBlackfeetBolivianBrazilianBritishBritish West IndianBulgarianBurmeseCajunCambodianCanadianCape VerdeanCarpatho RusynCelticCentral AmericanCentral American IndianCherokeeCheyenneChickasawChileanChineseChippewaChoctawColombianColvilleComancheCosta RicanCreeCreekCroatianCrowCubanCypriotCzechCzechoslovakianDanishDelawareDominicanDutchDutch West IndianEastern EuropeanEcuadorianEgyptianEnglishEstonianEthiopianEuropeanFijianFinnishFrenchFrench American IndianFrench CanadianGermanGerman RussianGhanaianGreekGuamanian/ChamorroGuatemalanGuyaneseHaitianHmongHonduranHopiHoumaHungarianIcelanderIndian (Asian)IndonesianInupiatIranianIraqiIrishIroquoisIsraeliItalianJamaicanJapaneseJordanianKenyanKiowaKoreanLaotianLatvianLebaneseLiberianLithuanianLumbeeLuxembourgerMacedonianMalaysianMalteseMarshalleseMenomineeMexicanMexican American IndianMongolianMoroccanNative HawaiianNavajoNepaleseNew ZealanderNicaraguanNigerianNorthern EuropeanNorwegianOkinawanOsageOttawaPaiutePakistaniPalestinianPanamanianParaguayanPennsylvania GermanPeruvianPimaPolishPortuguesePotawatomiPuebloPuerto RicanPuget Sound SalishRomanianRussianSalvadoranSamoanScandinavianScotch-IrishScottishSeminoleSenegaleseSerbianShoshoneSierra LeoneanSiouxSlavicSlovakSloveneSomaliSouth AfricanSouth AmericanSouth American IndianSoviet UnionSpaniardSpanishSpanish AmericanSpanish American IndianSri LankanSubsaharan AfricanSudaneseSwedishSwissSyrianTaiwaneseThaiTlingit-HaidaTohono O'OdhamTonganTrinidadian and TobagonianTsimshianTurkishU.S. Virgin IslanderUgandanUkrainianUruguayanUteVenezuelanVietnameseWelshWest IndianYakamaYaquiYugoslavianYumanYup'ikZimbabwean
Immigration
NonimmigrantsImmigrantsAfghanistanAfricaAlbaniaArgentinaArmeniaAsiaAustraliaAustriaBahamasBangladeshBarbadosBelarusBelgiumBelizeBoliviaBosnia and HerzegovinaBrazilBulgariaBurma/MyanmarCabo VerdeCambodiaCameroonCanadaCaribbeanCentral AmericaChileChinaColombiaCongoCosta RicaCroatiaCubaCzechoslovakiaDenmarkDominicaDominican RepublicEastern AfricaEastern AsiaEastern EuropeEcuadorEgyptEl SalvadorEnglandEritreaEthiopiaEuropeFijiFranceGermanyGhanaGreeceGrenadaGuatemalaGuyanaHaitiHondurasHong KongHungaryIndiaIndonesiaIranIraqIrelandIsraelItalyJamaicaJapanJordanKazakhstanKenyaKoreaKuwaitLaosLatin AmericaLatviaLebanonLiberiaLithuaniaMalaysiaMexicoMicronesiaMiddle AfricaMoldovaMoroccoNepalNetherlandsNicaraguaNigeriaNorth AmericaNorth MacedoniaNorthern AfricaNorthern EuropeNorwayOceaniaPakistanPanamaPeruPhilippinesPolandPortugalRomaniaRussiaSaudi ArabiaScotlandSenegalSerbiaSierra LeoneSingaporeSomaliaSouth AfricaSouth AmericaSouth Central AsiaSouth Eastern AsiaSouthern EuropeSpainSri LankaSt. Vincent and the GrenadinesSudanSwedenSwitzerlandSyriaTaiwanThailandTrinidad and TobagoTurkeyUgandaUkraineUruguayUzbekistanVenezuelaVietnamWest IndiesWestern AfricaWestern AsiaWestern EuropeYemenZaireZimbabweAzores
Filipino
Race
Ancestry
AfghanAfricanAlaska NativeAlaskan AthabascanAlbanianAleutAlsatianAmericanApacheArabArapahoArgentineanArmenianAssyrian/Chaldean/SyriacAustralianAustrianBahamianBangladeshiBarbadianBasqueBelgianBelizeanBermudanBhutaneseBlackfeetBolivianBrazilianBritishBritish West IndianBulgarianBurmeseCajunCambodianCanadianCape VerdeanCarpatho RusynCelticCentral AmericanCentral American IndianCherokeeCheyenneChickasawChileanChineseChippewaChoctawColombianColvilleComancheCosta RicanCreeCreekCroatianCrowCubanCypriotCzechCzechoslovakianDanishDelawareDominicanDutchDutch West IndianEastern EuropeanEcuadorianEgyptianEnglishEstonianEthiopianEuropeanFijianFilipinoFinnishFrenchFrench American IndianFrench CanadianGermanGerman RussianGreekGuamanian/ChamorroGuatemalanGuyaneseHaitianHmongHonduranHopiHoumaHungarianIcelanderIndian (Asian)IndonesianInupiatIranianIraqiIrishIroquoisIsraeliItalianJamaicanJapaneseJordanianKenyanKiowaKoreanLaotianLatvianLebaneseLiberianLithuanianLumbeeLuxembourgerMacedonianMalaysianMalteseMarshalleseMenomineeMexicanMexican American IndianMongolianMoroccanNative HawaiianNavajoNepaleseNew ZealanderNicaraguanNigerianNorthern EuropeanNorwegianOkinawanOsageOttawaPaiutePakistaniPalestinianPanamanianParaguayanPennsylvania GermanPeruvianPimaPolishPortuguesePotawatomiPuebloPuerto RicanPuget Sound SalishRomanianRussianSalvadoranSamoanScandinavianScotch-IrishScottishSeminoleSenegaleseSerbianShoshoneSierra LeoneanSiouxSlavicSlovakSloveneSomaliSouth AfricanSouth AmericanSouth American IndianSoviet UnionSpaniardSpanishSpanish AmericanSpanish American IndianSri LankanSubsaharan AfricanSudaneseSwedishSwissSyrianTaiwaneseThaiTlingit-HaidaTohono O'OdhamTonganTrinidadian and TobagonianTsimshianTurkishU.S. Virgin IslanderUgandanUkrainianUruguayanUteVenezuelanVietnameseWelshWest IndianYakamaYaquiYugoslavianYumanYup'ikZimbabwean
Immigration
NonimmigrantsImmigrantsAfghanistanAfricaAlbaniaArgentinaArmeniaAsiaAustraliaAustriaBahamasBangladeshBarbadosBelarusBelgiumBelizeBoliviaBosnia and HerzegovinaBrazilBulgariaBurma/MyanmarCabo VerdeCambodiaCameroonCanadaCaribbeanCentral AmericaChileChinaColombiaCongoCosta RicaCroatiaCubaCzechoslovakiaDenmarkDominicaDominican RepublicEastern AfricaEastern AsiaEastern EuropeEcuadorEgyptEl SalvadorEnglandEritreaEthiopiaEuropeFijiFranceGermanyGhanaGreeceGrenadaGuatemalaGuyanaHaitiHondurasHong KongHungaryIndiaIndonesiaIranIraqIrelandIsraelItalyJamaicaJapanJordanKazakhstanKenyaKoreaKuwaitLaosLatin AmericaLatviaLebanonLiberiaLithuaniaMalaysiaMexicoMicronesiaMiddle AfricaMoldovaMoroccoNepalNetherlandsNicaraguaNigeriaNorth AmericaNorth MacedoniaNorthern AfricaNorthern EuropeNorwayOceaniaPakistanPanamaPeruPhilippinesPolandPortugalRomaniaRussiaSaudi ArabiaScotlandSenegalSerbiaSierra LeoneSingaporeSomaliaSouth AfricaSouth AmericaSouth Central AsiaSouth Eastern AsiaSouthern EuropeSpainSri LankaSt. Vincent and the GrenadinesSudanSwedenSwitzerlandSyriaTaiwanThailandTrinidad and TobagoTurkeyUgandaUkraineUruguayUzbekistanVenezuelaVietnamWest IndiesWestern AfricaWestern AsiaWestern EuropeYemenZaireZimbabweAzores
Median Male Earnings
Income
Poverty
Unemployment
Labor Participation
Family Structure
Vehicle Availability
Education Level
Disability

Median Male Earnings Comparison

Ghanaians

Filipinos

Poor
Exceptional
$52,810
MEDIAN MALE EARNINGS
16.1/ 100
METRIC RATING
204th/ 347
METRIC RANK
$74,224
MEDIAN MALE EARNINGS
100.0/ 100
METRIC RATING
1st/ 347
METRIC RANK

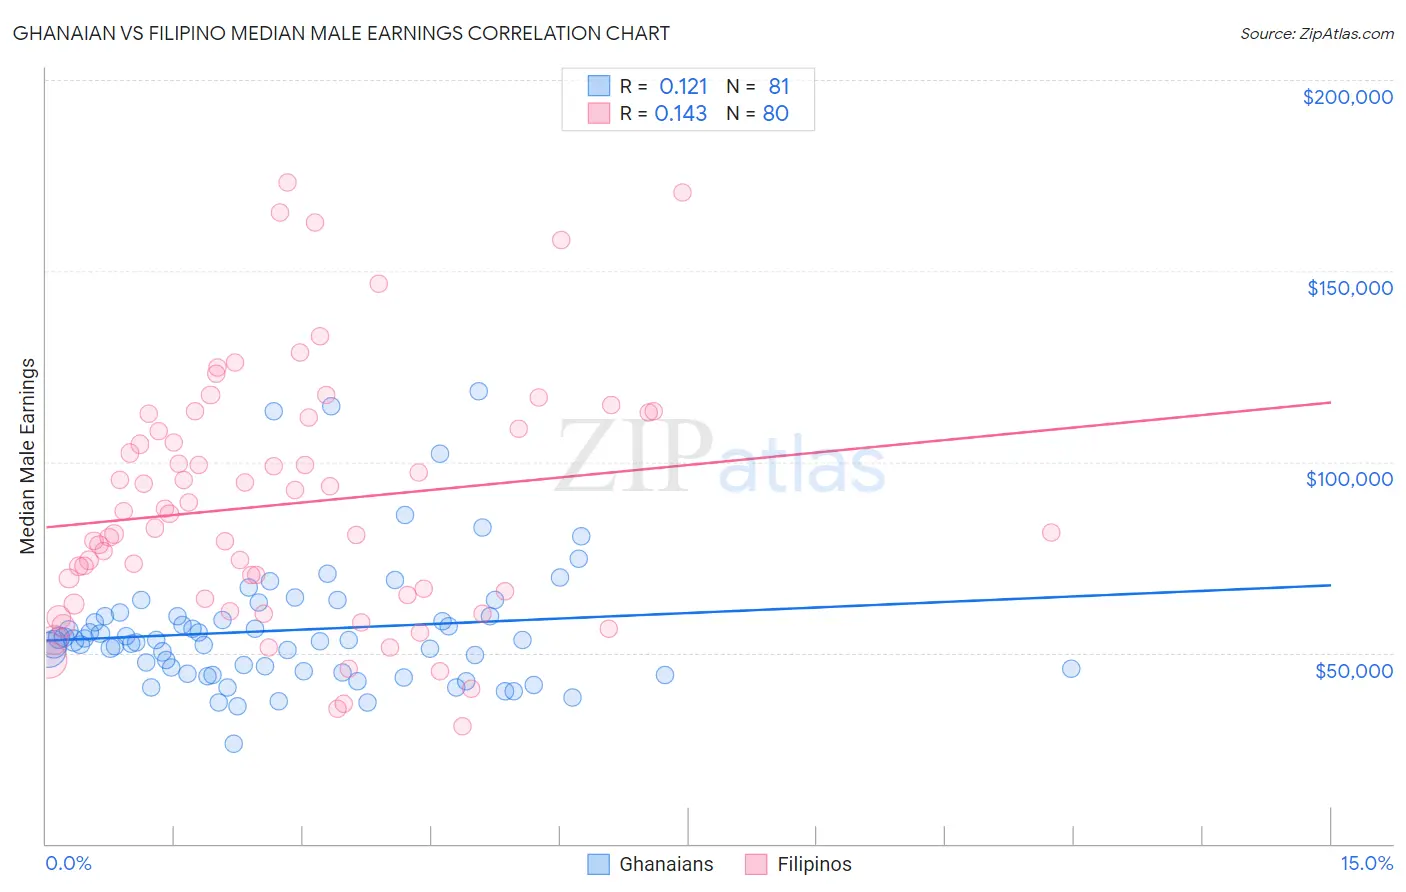
Ghanaian vs Filipino Median Male Earnings Correlation Chart

The statistical analysis conducted on geographies consisting of 190,703,925 people shows a poor positive correlation between the proportion of Ghanaians and median male earnings in the United States with a correlation coefficient (R) of 0.121 and weighted average of $52,810. Similarly, the statistical analysis conducted on geographies consisting of 254,342,119 people shows a poor positive correlation between the proportion of Filipinos and median male earnings in the United States with a correlation coefficient (R) of 0.143 and weighted average of $74,224, a difference of 40.6%.
Ghanaian vs Filipino Median Male Earnings

Median Male Earnings Correlation Summary

MeasurementGhanaianFilipino
Minimum$26,089$30,694
Maximum$118,333$173,150
Range$92,244$142,456
Mean$55,935$88,887
Median$53,206$84,592
Interquartile 25% (IQ1)$44,949$64,781
Interquartile 75% (IQ3)$59,627$110,251
Interquartile Range (IQR)$14,678$45,470
Standard Deviation (Sample)$16,875$32,365
Standard Deviation (Population)$16,771$32,162

Similar Demographics by Median Male Earnings

Demographics Similar to Ghanaians by Median Male Earnings

In terms of median male earnings, the demographic groups most similar to Ghanaians are Panamanian ($52,835, a difference of 0.050%), Immigrants from Uruguay ($52,860, a difference of 0.10%), Immigrants from Bosnia and Herzegovina ($52,869, a difference of 0.11%), Immigrants from Colombia ($52,725, a difference of 0.16%), and Immigrants from Thailand ($52,908, a difference of 0.19%).
DemographicsRating | RankMedian Male Earnings
Immigrants | Kenya
26.0
/100
|
#197
Fair
$53,427
Immigrants | Costa Rica
22.6
/100
|
#198
Fair
$53,237
Tongans
22.3
/100
|
#199
Fair
$53,218
Immigrants | Thailand
17.5
/100
|
#200
Poor
$52,908
Immigrants | Bosnia and Herzegovina
16.9
/100
|
#201
Poor
$52,869
Immigrants | Uruguay
16.8
/100
|
#202
Poor
$52,860
Panamanians
16.5
/100
|
#203
Poor
$52,835
Ghanaians
16.1
/100
|
#204
Poor
$52,810
Immigrants | Colombia
15.0
/100
|
#205
Poor
$52,725
Immigrants | Iraq
14.5
/100
|
#206
Poor
$52,681
Vietnamese
12.7
/100
|
#207
Poor
$52,525
Venezuelans
12.5
/100
|
#208
Poor
$52,510
Bermudans
12.1
/100
|
#209
Poor
$52,465
Delaware
11.5
/100
|
#210
Poor
$52,412
Tlingit-Haida
11.5
/100
|
#211
Poor
$52,409

Demographics Similar to Filipinos by Median Male Earnings

In terms of median male earnings, the demographic groups most similar to Filipinos are Immigrants from India ($74,207, a difference of 0.020%), Immigrants from Taiwan ($74,031, a difference of 0.26%), Thai ($72,135, a difference of 2.9%), Immigrants from Singapore ($71,348, a difference of 4.0%), and Iranian ($70,648, a difference of 5.1%).
DemographicsRating | RankMedian Male Earnings
Filipinos
100.0
/100
|
#1
Exceptional
$74,224
Immigrants | India
100.0
/100
|
#2
Exceptional
$74,207
Immigrants | Taiwan
100.0
/100
|
#3
Exceptional
$74,031
Thais
100.0
/100
|
#4
Exceptional
$72,135
Immigrants | Singapore
100.0
/100
|
#5
Exceptional
$71,348
Iranians
100.0
/100
|
#6
Exceptional
$70,648
Immigrants | Hong Kong
100.0
/100
|
#7
Exceptional
$70,146
Immigrants | Iran
100.0
/100
|
#8
Exceptional
$69,284
Immigrants | South Central Asia
100.0
/100
|
#9
Exceptional
$68,960
Immigrants | Israel
100.0
/100
|
#10
Exceptional
$68,716
Immigrants | Ireland
100.0
/100
|
#11
Exceptional
$67,698
Immigrants | Australia
100.0
/100
|
#12
Exceptional
$67,634
Immigrants | China
100.0
/100
|
#13
Exceptional
$67,353
Okinawans
100.0
/100
|
#14
Exceptional
$67,232
Immigrants | Eastern Asia
100.0
/100
|
#15
Exceptional
$66,903