English vs Macedonian Median Family Income
COMPARE
English
Macedonian
Median Family Income
Median Family Income Comparison
English
Macedonians
$103,684
MEDIAN FAMILY INCOME
62.6/ 100
METRIC RATING
166th/ 347
METRIC RANK
$109,668
MEDIAN FAMILY INCOME
97.3/ 100
METRIC RATING
100th/ 347
METRIC RANK
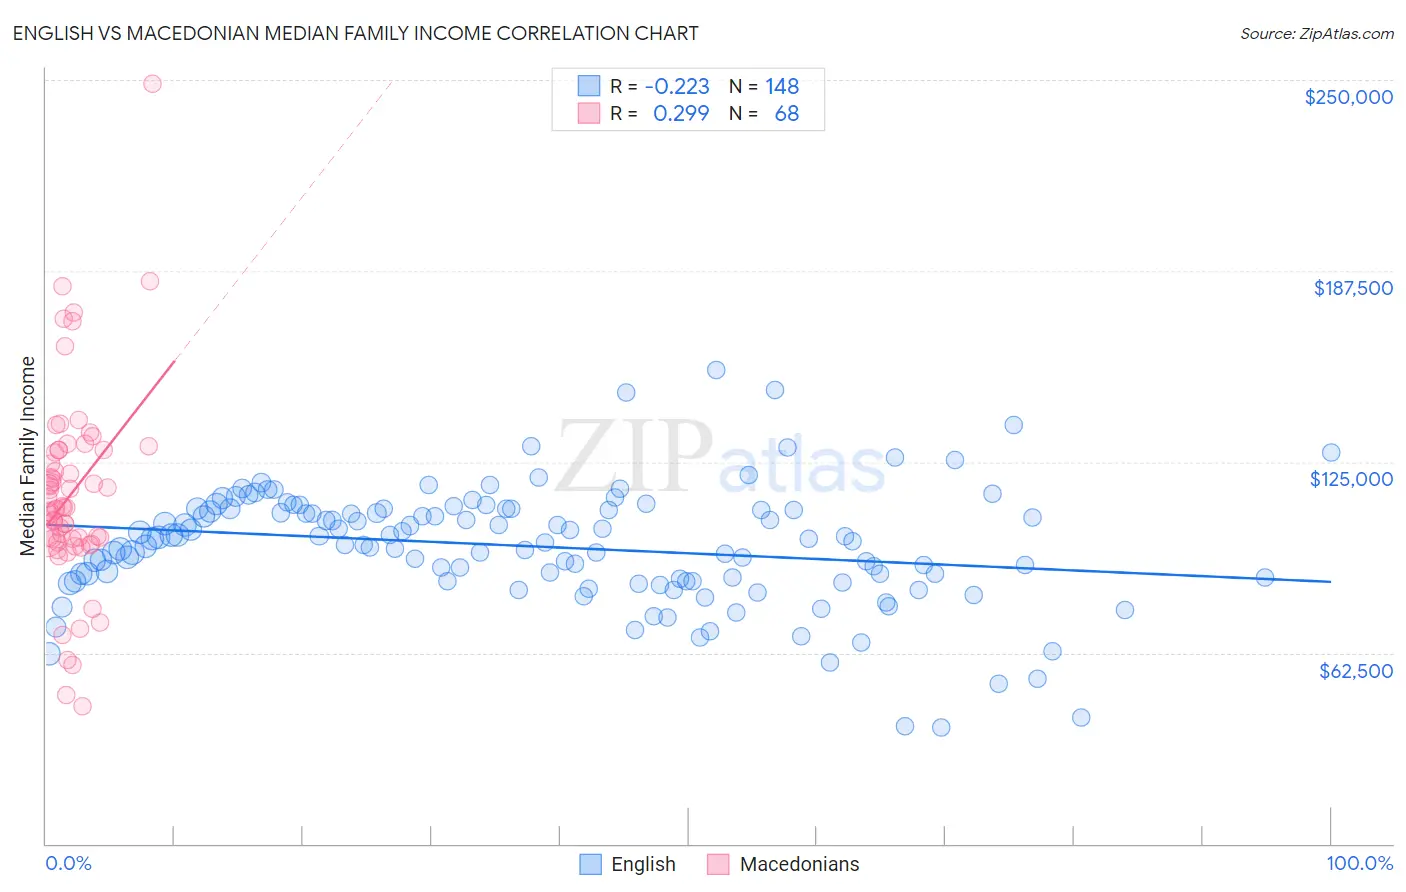
English vs Macedonian Median Family Income Correlation Chart
The statistical analysis conducted on geographies consisting of 578,007,512 people shows a weak negative correlation between the proportion of English and median family income in the United States with a correlation coefficient (R) of -0.223 and weighted average of $103,684. Similarly, the statistical analysis conducted on geographies consisting of 132,508,539 people shows a weak positive correlation between the proportion of Macedonians and median family income in the United States with a correlation coefficient (R) of 0.299 and weighted average of $109,668, a difference of 5.8%.
Median Family Income Correlation Summary
| Measurement | English | Macedonian |
| Minimum | $37,941 | $44,804 |
| Maximum | $155,034 | $248,750 |
| Range | $117,093 | $203,946 |
| Mean | $97,321 | $114,576 |
| Median | $99,521 | $110,196 |
| Interquartile 25% (IQ1) | $86,021 | $99,876 |
| Interquartile 75% (IQ3) | $109,417 | $128,750 |
| Interquartile Range (IQR) | $23,396 | $28,874 |
| Standard Deviation (Sample) | $19,404 | $32,654 |
| Standard Deviation (Population) | $19,339 | $32,413 |
Similar Demographics by Median Family Income
Demographics Similar to English by Median Family Income
In terms of median family income, the demographic groups most similar to English are Slovak ($103,729, a difference of 0.040%), South American Indian ($103,624, a difference of 0.060%), Immigrants from Peru ($103,534, a difference of 0.15%), Sierra Leonean ($103,859, a difference of 0.17%), and Immigrants from Sierra Leone ($103,990, a difference of 0.29%).
| Demographics | Rating | Rank | Median Family Income |
| Swiss | 70.7 /100 | #159 | Good $104,396 |
| Scottish | 69.5 /100 | #160 | Good $104,288 |
| Icelanders | 69.4 /100 | #161 | Good $104,282 |
| Immigrants | Sierra Leone | 66.2 /100 | #162 | Good $103,990 |
| Costa Ricans | 66.2 /100 | #163 | Good $103,989 |
| Sierra Leoneans | 64.7 /100 | #164 | Good $103,859 |
| Slovaks | 63.1 /100 | #165 | Good $103,729 |
| English | 62.6 /100 | #166 | Good $103,684 |
| South American Indians | 61.9 /100 | #167 | Good $103,624 |
| Immigrants | Peru | 60.8 /100 | #168 | Good $103,534 |
| Czechoslovakians | 57.6 /100 | #169 | Average $103,273 |
| Immigrants | Uzbekistan | 56.6 /100 | #170 | Average $103,197 |
| Alsatians | 54.3 /100 | #171 | Average $103,010 |
| Immigrants | Eritrea | 51.9 /100 | #172 | Average $102,823 |
| Belgians | 51.4 /100 | #173 | Average $102,788 |
Demographics Similar to Macedonians by Median Family Income
In terms of median family income, the demographic groups most similar to Macedonians are Armenian ($109,692, a difference of 0.020%), Immigrants from Ukraine ($109,645, a difference of 0.020%), Assyrian/Chaldean/Syriac ($109,622, a difference of 0.040%), Immigrants from Kuwait ($109,731, a difference of 0.060%), and Jordanian ($109,865, a difference of 0.18%).
| Demographics | Rating | Rank | Median Family Income |
| Immigrants | Kazakhstan | 97.8 /100 | #93 | Exceptional $110,137 |
| Koreans | 97.8 /100 | #94 | Exceptional $110,103 |
| Zimbabweans | 97.7 /100 | #95 | Exceptional $110,011 |
| Immigrants | Moldova | 97.7 /100 | #96 | Exceptional $109,975 |
| Jordanians | 97.5 /100 | #97 | Exceptional $109,865 |
| Immigrants | Kuwait | 97.4 /100 | #98 | Exceptional $109,731 |
| Armenians | 97.3 /100 | #99 | Exceptional $109,692 |
| Macedonians | 97.3 /100 | #100 | Exceptional $109,668 |
| Immigrants | Ukraine | 97.2 /100 | #101 | Exceptional $109,645 |
| Assyrians/Chaldeans/Syriacs | 97.2 /100 | #102 | Exceptional $109,622 |
| Immigrants | Brazil | 96.9 /100 | #103 | Exceptional $109,418 |
| Palestinians | 96.9 /100 | #104 | Exceptional $109,413 |
| Syrians | 96.7 /100 | #105 | Exceptional $109,299 |
| Albanians | 96.4 /100 | #106 | Exceptional $109,136 |
| Immigrants | North Macedonia | 96.4 /100 | #107 | Exceptional $109,136 |