English vs Immigrants from Ghana Median Family Income
COMPARE
English
Immigrants from Ghana
Median Family Income
Median Family Income Comparison
English
Immigrants from Ghana
$103,684
MEDIAN FAMILY INCOME
62.6/ 100
METRIC RATING
166th/ 347
METRIC RANK
$96,544
MEDIAN FAMILY INCOME
4.2/ 100
METRIC RATING
221st/ 347
METRIC RANK
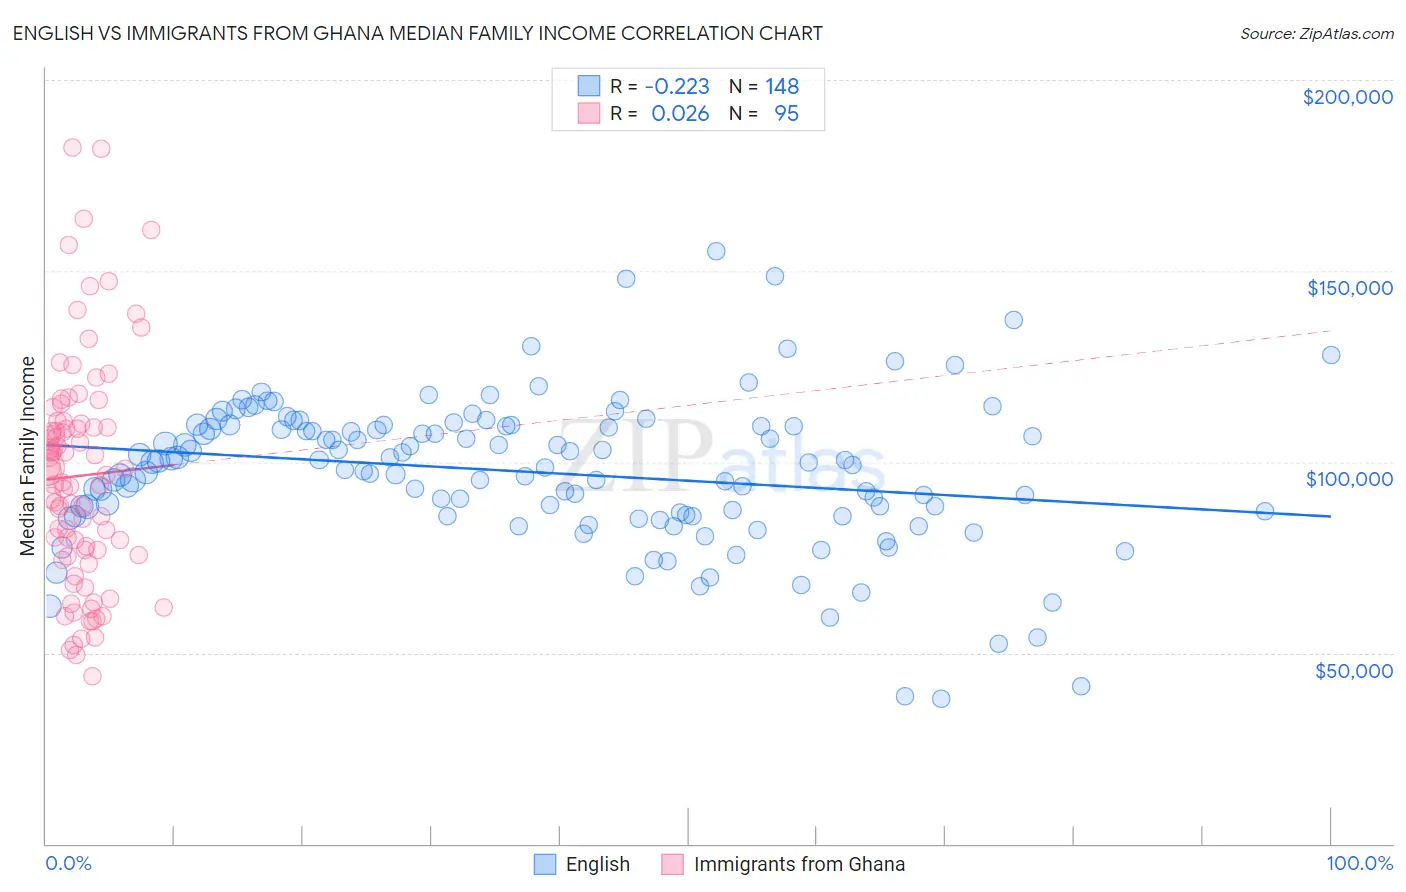
English vs Immigrants from Ghana Median Family Income Correlation Chart
The statistical analysis conducted on geographies consisting of 578,007,512 people shows a weak negative correlation between the proportion of English and median family income in the United States with a correlation coefficient (R) of -0.223 and weighted average of $103,684. Similarly, the statistical analysis conducted on geographies consisting of 199,771,663 people shows no correlation between the proportion of Immigrants from Ghana and median family income in the United States with a correlation coefficient (R) of 0.026 and weighted average of $96,544, a difference of 7.4%.
Median Family Income Correlation Summary
| Measurement | English | Immigrants from Ghana |
| Minimum | $37,941 | $43,736 |
| Maximum | $155,034 | $182,203 |
| Range | $117,093 | $138,466 |
| Mean | $97,321 | $96,337 |
| Median | $99,521 | $96,719 |
| Interquartile 25% (IQ1) | $86,021 | $75,639 |
| Interquartile 75% (IQ3) | $109,417 | $110,050 |
| Interquartile Range (IQR) | $23,396 | $34,411 |
| Standard Deviation (Sample) | $19,404 | $29,276 |
| Standard Deviation (Population) | $19,339 | $29,122 |
Similar Demographics by Median Family Income
Demographics Similar to English by Median Family Income
In terms of median family income, the demographic groups most similar to English are Slovak ($103,729, a difference of 0.040%), South American Indian ($103,624, a difference of 0.060%), Immigrants from Peru ($103,534, a difference of 0.15%), Sierra Leonean ($103,859, a difference of 0.17%), and Immigrants from Sierra Leone ($103,990, a difference of 0.29%).
| Demographics | Rating | Rank | Median Family Income |
| Swiss | 70.7 /100 | #159 | Good $104,396 |
| Scottish | 69.5 /100 | #160 | Good $104,288 |
| Icelanders | 69.4 /100 | #161 | Good $104,282 |
| Immigrants | Sierra Leone | 66.2 /100 | #162 | Good $103,990 |
| Costa Ricans | 66.2 /100 | #163 | Good $103,989 |
| Sierra Leoneans | 64.7 /100 | #164 | Good $103,859 |
| Slovaks | 63.1 /100 | #165 | Good $103,729 |
| English | 62.6 /100 | #166 | Good $103,684 |
| South American Indians | 61.9 /100 | #167 | Good $103,624 |
| Immigrants | Peru | 60.8 /100 | #168 | Good $103,534 |
| Czechoslovakians | 57.6 /100 | #169 | Average $103,273 |
| Immigrants | Uzbekistan | 56.6 /100 | #170 | Average $103,197 |
| Alsatians | 54.3 /100 | #171 | Average $103,010 |
| Immigrants | Eritrea | 51.9 /100 | #172 | Average $102,823 |
| Belgians | 51.4 /100 | #173 | Average $102,788 |
Demographics Similar to Immigrants from Ghana by Median Family Income
In terms of median family income, the demographic groups most similar to Immigrants from Ghana are Immigrants from Nigeria ($96,439, a difference of 0.11%), Sudanese ($96,783, a difference of 0.25%), Venezuelan ($96,281, a difference of 0.27%), Nonimmigrants ($96,231, a difference of 0.33%), and Delaware ($96,958, a difference of 0.43%).
| Demographics | Rating | Rank | Median Family Income |
| Bermudans | 6.9 /100 | #214 | Tragic $97,577 |
| Nigerians | 6.7 /100 | #215 | Tragic $97,522 |
| Immigrants | Bosnia and Herzegovina | 6.4 /100 | #216 | Tragic $97,432 |
| Japanese | 6.0 /100 | #217 | Tragic $97,288 |
| Immigrants | Cambodia | 5.8 /100 | #218 | Tragic $97,222 |
| Delaware | 5.1 /100 | #219 | Tragic $96,958 |
| Sudanese | 4.7 /100 | #220 | Tragic $96,783 |
| Immigrants | Ghana | 4.2 /100 | #221 | Tragic $96,544 |
| Immigrants | Nigeria | 4.0 /100 | #222 | Tragic $96,439 |
| Venezuelans | 3.7 /100 | #223 | Tragic $96,281 |
| Immigrants | Nonimmigrants | 3.6 /100 | #224 | Tragic $96,231 |
| Vietnamese | 3.4 /100 | #225 | Tragic $96,123 |
| Immigrants | Panama | 2.7 /100 | #226 | Tragic $95,647 |
| Alaska Natives | 2.6 /100 | #227 | Tragic $95,573 |
| Immigrants | Azores | 2.4 /100 | #228 | Tragic $95,402 |