English vs Chippewa Median Family Income
COMPARE
English
Chippewa
Median Family Income
Median Family Income Comparison
English
Chippewa
$103,684
MEDIAN FAMILY INCOME
62.6/ 100
METRIC RATING
166th/ 347
METRIC RANK
$86,852
MEDIAN FAMILY INCOME
0.0/ 100
METRIC RATING
299th/ 347
METRIC RANK
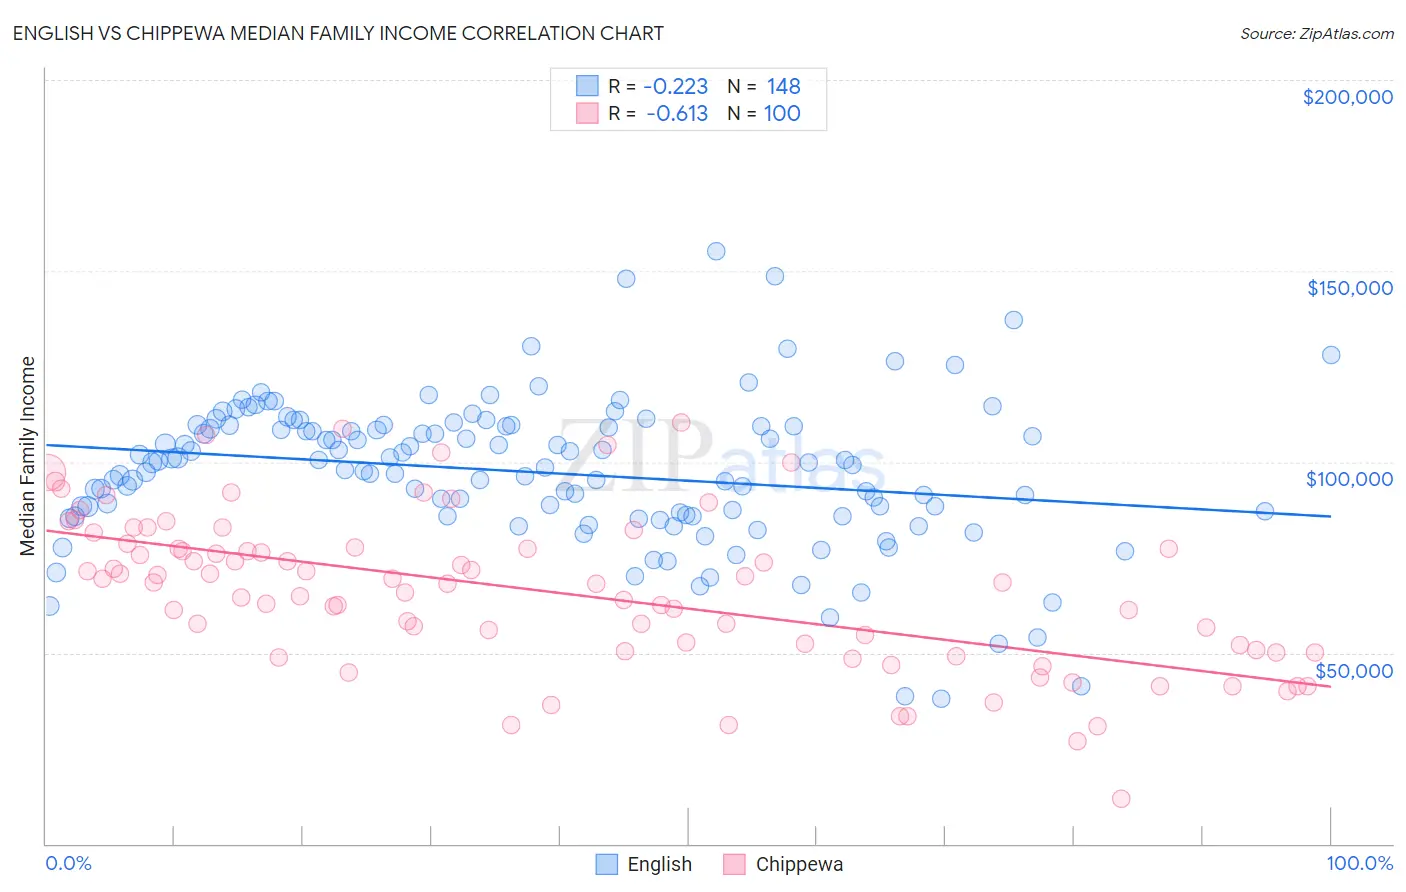
English vs Chippewa Median Family Income Correlation Chart
The statistical analysis conducted on geographies consisting of 578,007,512 people shows a weak negative correlation between the proportion of English and median family income in the United States with a correlation coefficient (R) of -0.223 and weighted average of $103,684. Similarly, the statistical analysis conducted on geographies consisting of 214,970,726 people shows a significant negative correlation between the proportion of Chippewa and median family income in the United States with a correlation coefficient (R) of -0.613 and weighted average of $86,852, a difference of 19.4%.
Median Family Income Correlation Summary
| Measurement | English | Chippewa |
| Minimum | $37,941 | $11,667 |
| Maximum | $155,034 | $110,455 |
| Range | $117,093 | $98,788 |
| Mean | $97,321 | $65,965 |
| Median | $99,521 | $68,273 |
| Interquartile 25% (IQ1) | $86,021 | $50,598 |
| Interquartile 75% (IQ3) | $109,417 | $77,379 |
| Interquartile Range (IQR) | $23,396 | $26,781 |
| Standard Deviation (Sample) | $19,404 | $20,173 |
| Standard Deviation (Population) | $19,339 | $20,072 |
Similar Demographics by Median Family Income
Demographics Similar to English by Median Family Income
In terms of median family income, the demographic groups most similar to English are Slovak ($103,729, a difference of 0.040%), South American Indian ($103,624, a difference of 0.060%), Immigrants from Peru ($103,534, a difference of 0.15%), Sierra Leonean ($103,859, a difference of 0.17%), and Immigrants from Sierra Leone ($103,990, a difference of 0.29%).
| Demographics | Rating | Rank | Median Family Income |
| Swiss | 70.7 /100 | #159 | Good $104,396 |
| Scottish | 69.5 /100 | #160 | Good $104,288 |
| Icelanders | 69.4 /100 | #161 | Good $104,282 |
| Immigrants | Sierra Leone | 66.2 /100 | #162 | Good $103,990 |
| Costa Ricans | 66.2 /100 | #163 | Good $103,989 |
| Sierra Leoneans | 64.7 /100 | #164 | Good $103,859 |
| Slovaks | 63.1 /100 | #165 | Good $103,729 |
| English | 62.6 /100 | #166 | Good $103,684 |
| South American Indians | 61.9 /100 | #167 | Good $103,624 |
| Immigrants | Peru | 60.8 /100 | #168 | Good $103,534 |
| Czechoslovakians | 57.6 /100 | #169 | Average $103,273 |
| Immigrants | Uzbekistan | 56.6 /100 | #170 | Average $103,197 |
| Alsatians | 54.3 /100 | #171 | Average $103,010 |
| Immigrants | Eritrea | 51.9 /100 | #172 | Average $102,823 |
| Belgians | 51.4 /100 | #173 | Average $102,788 |
Demographics Similar to Chippewa by Median Family Income
In terms of median family income, the demographic groups most similar to Chippewa are Immigrants from Latin America ($86,989, a difference of 0.16%), Cajun ($87,157, a difference of 0.35%), Immigrants from Guatemala ($87,191, a difference of 0.39%), Yaqui ($87,289, a difference of 0.50%), and Ottawa ($86,380, a difference of 0.55%).
| Demographics | Rating | Rank | Median Family Income |
| Africans | 0.1 /100 | #292 | Tragic $87,820 |
| Ute | 0.0 /100 | #293 | Tragic $87,596 |
| Fijians | 0.0 /100 | #294 | Tragic $87,387 |
| Yaqui | 0.0 /100 | #295 | Tragic $87,289 |
| Immigrants | Guatemala | 0.0 /100 | #296 | Tragic $87,191 |
| Cajuns | 0.0 /100 | #297 | Tragic $87,157 |
| Immigrants | Latin America | 0.0 /100 | #298 | Tragic $86,989 |
| Chippewa | 0.0 /100 | #299 | Tragic $86,852 |
| Ottawa | 0.0 /100 | #300 | Tragic $86,380 |
| Colville | 0.0 /100 | #301 | Tragic $85,792 |
| Spanish American Indians | 0.0 /100 | #302 | Tragic $85,728 |
| Hispanics or Latinos | 0.0 /100 | #303 | Tragic $85,647 |
| Mexicans | 0.0 /100 | #304 | Tragic $85,618 |
| Paiute | 0.0 /100 | #305 | Tragic $85,414 |
| Immigrants | Dominica | 0.0 /100 | #306 | Tragic $85,411 |