English vs Macedonian Unemployment Among Ages 16 to 19 years
COMPARE
English
Macedonian
Unemployment Among Ages 16 to 19 years
Unemployment Among Ages 16 to 19 years Comparison
English
Macedonians
16.1%
UNEMPLOYMENT AMONG AGES 16 TO 19 YEARS
99.9/ 100
METRIC RATING
31st/ 347
METRIC RANK
16.6%
UNEMPLOYMENT AMONG AGES 16 TO 19 YEARS
99.2/ 100
METRIC RATING
62nd/ 347
METRIC RANK
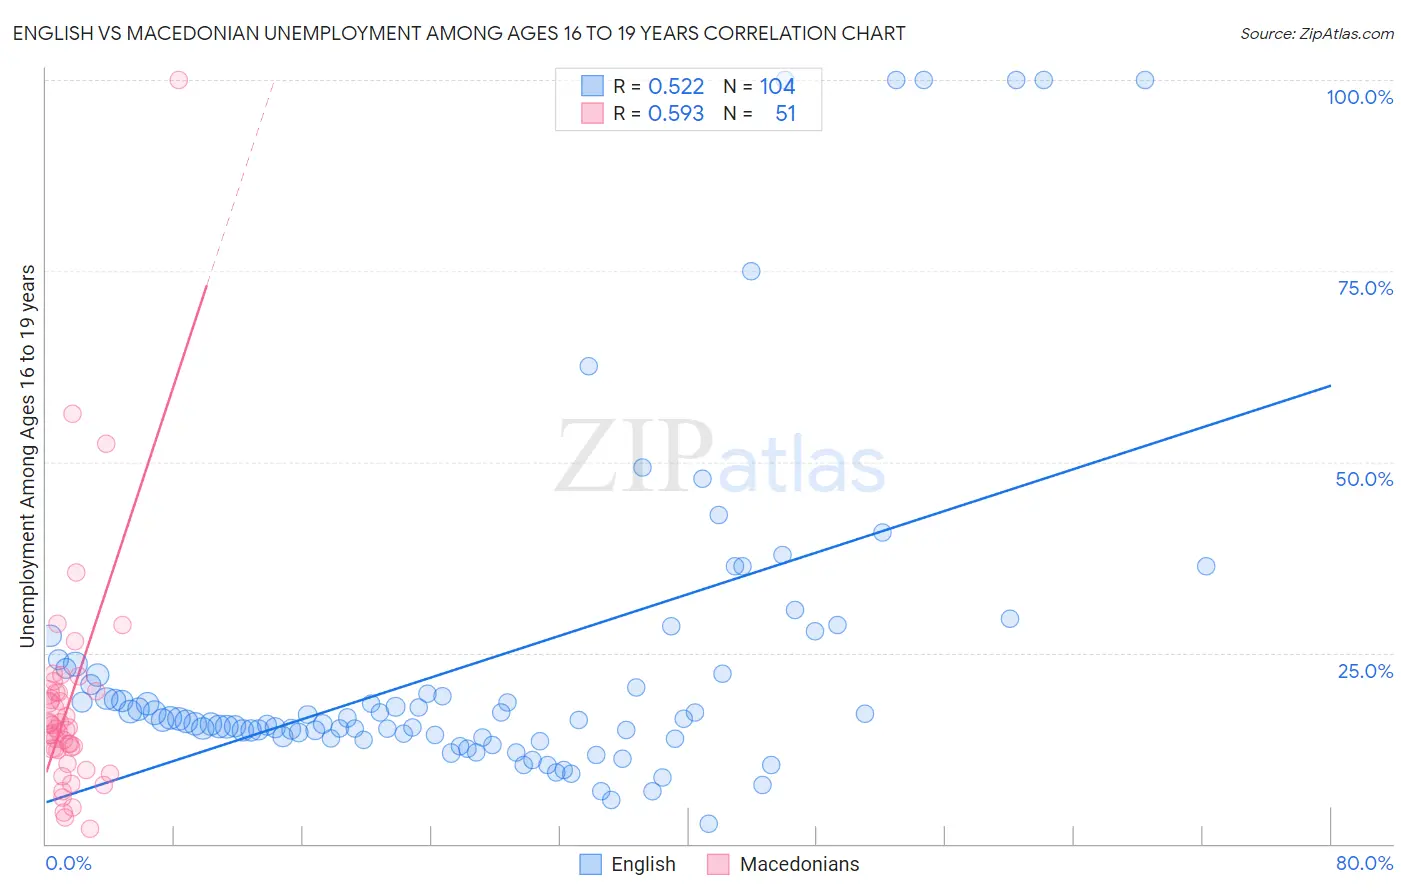
English vs Macedonian Unemployment Among Ages 16 to 19 years Correlation Chart
The statistical analysis conducted on geographies consisting of 511,616,305 people shows a substantial positive correlation between the proportion of English and unemployment rate among population between the ages 16 and 19 in the United States with a correlation coefficient (R) of 0.522 and weighted average of 16.1%. Similarly, the statistical analysis conducted on geographies consisting of 129,038,404 people shows a substantial positive correlation between the proportion of Macedonians and unemployment rate among population between the ages 16 and 19 in the United States with a correlation coefficient (R) of 0.593 and weighted average of 16.6%, a difference of 3.2%.
Unemployment Among Ages 16 to 19 years Correlation Summary
| Measurement | English | Macedonian |
| Minimum | 2.7% | 2.0% |
| Maximum | 100.0% | 100.0% |
| Range | 97.3% | 98.0% |
| Mean | 23.8% | 18.3% |
| Median | 16.2% | 15.0% |
| Interquartile 25% (IQ1) | 14.0% | 12.3% |
| Interquartile 75% (IQ3) | 22.2% | 19.9% |
| Interquartile Range (IQR) | 8.2% | 7.6% |
| Standard Deviation (Sample) | 21.9% | 15.5% |
| Standard Deviation (Population) | 21.8% | 15.3% |
Similar Demographics by Unemployment Among Ages 16 to 19 years
Demographics Similar to English by Unemployment Among Ages 16 to 19 years
In terms of unemployment among ages 16 to 19 years, the demographic groups most similar to English are Kenyan (16.1%, a difference of 0.050%), Chinese (16.0%, a difference of 0.090%), Jordanian (16.0%, a difference of 0.14%), Immigrants from Sudan (16.0%, a difference of 0.32%), and European (16.1%, a difference of 0.39%).
| Demographics | Rating | Rank | Unemployment Among Ages 16 to 19 years |
| Tongans | 100.0 /100 | #24 | Exceptional 15.9% |
| Filipinos | 100.0 /100 | #25 | Exceptional 15.9% |
| Dutch | 100.0 /100 | #26 | Exceptional 15.9% |
| Immigrants | Sudan | 99.9 /100 | #27 | Exceptional 16.0% |
| Jordanians | 99.9 /100 | #28 | Exceptional 16.0% |
| Chinese | 99.9 /100 | #29 | Exceptional 16.0% |
| Kenyans | 99.9 /100 | #30 | Exceptional 16.1% |
| English | 99.9 /100 | #31 | Exceptional 16.1% |
| Europeans | 99.9 /100 | #32 | Exceptional 16.1% |
| Immigrants | Kenya | 99.9 /100 | #33 | Exceptional 16.2% |
| Pennsylvania Germans | 99.9 /100 | #34 | Exceptional 16.2% |
| Scottish | 99.8 /100 | #35 | Exceptional 16.2% |
| Immigrants | South Central Asia | 99.8 /100 | #36 | Exceptional 16.2% |
| Immigrants | Congo | 99.8 /100 | #37 | Exceptional 16.3% |
| Bulgarians | 99.8 /100 | #38 | Exceptional 16.3% |
Demographics Similar to Macedonians by Unemployment Among Ages 16 to 19 years
In terms of unemployment among ages 16 to 19 years, the demographic groups most similar to Macedonians are Immigrants from Cuba (16.6%, a difference of 0.10%), Menominee (16.6%, a difference of 0.16%), Scotch-Irish (16.6%, a difference of 0.18%), Northern European (16.6%, a difference of 0.25%), and Irish (16.5%, a difference of 0.33%).
| Demographics | Rating | Rank | Unemployment Among Ages 16 to 19 years |
| Czechoslovakians | 99.5 /100 | #55 | Exceptional 16.5% |
| Sri Lankans | 99.5 /100 | #56 | Exceptional 16.5% |
| Immigrants | Jordan | 99.4 /100 | #57 | Exceptional 16.5% |
| Immigrants | Uganda | 99.4 /100 | #58 | Exceptional 16.5% |
| Irish | 99.4 /100 | #59 | Exceptional 16.5% |
| Menominee | 99.3 /100 | #60 | Exceptional 16.6% |
| Immigrants | Cuba | 99.2 /100 | #61 | Exceptional 16.6% |
| Macedonians | 99.2 /100 | #62 | Exceptional 16.6% |
| Scotch-Irish | 99.1 /100 | #63 | Exceptional 16.6% |
| Northern Europeans | 99.0 /100 | #64 | Exceptional 16.6% |
| Immigrants | Japan | 98.9 /100 | #65 | Exceptional 16.6% |
| Okinawans | 98.9 /100 | #66 | Exceptional 16.6% |
| Slavs | 98.7 /100 | #67 | Exceptional 16.7% |
| Chickasaw | 98.7 /100 | #68 | Exceptional 16.7% |
| Serbians | 98.7 /100 | #69 | Exceptional 16.7% |