English vs Indian (Asian) Median Family Income
COMPARE
English
Indian (Asian)
Median Family Income
Median Family Income Comparison
English
Indians (Asian)
$103,684
MEDIAN FAMILY INCOME
62.6/ 100
METRIC RATING
166th/ 347
METRIC RANK
$125,312
MEDIAN FAMILY INCOME
100.0/ 100
METRIC RATING
17th/ 347
METRIC RANK
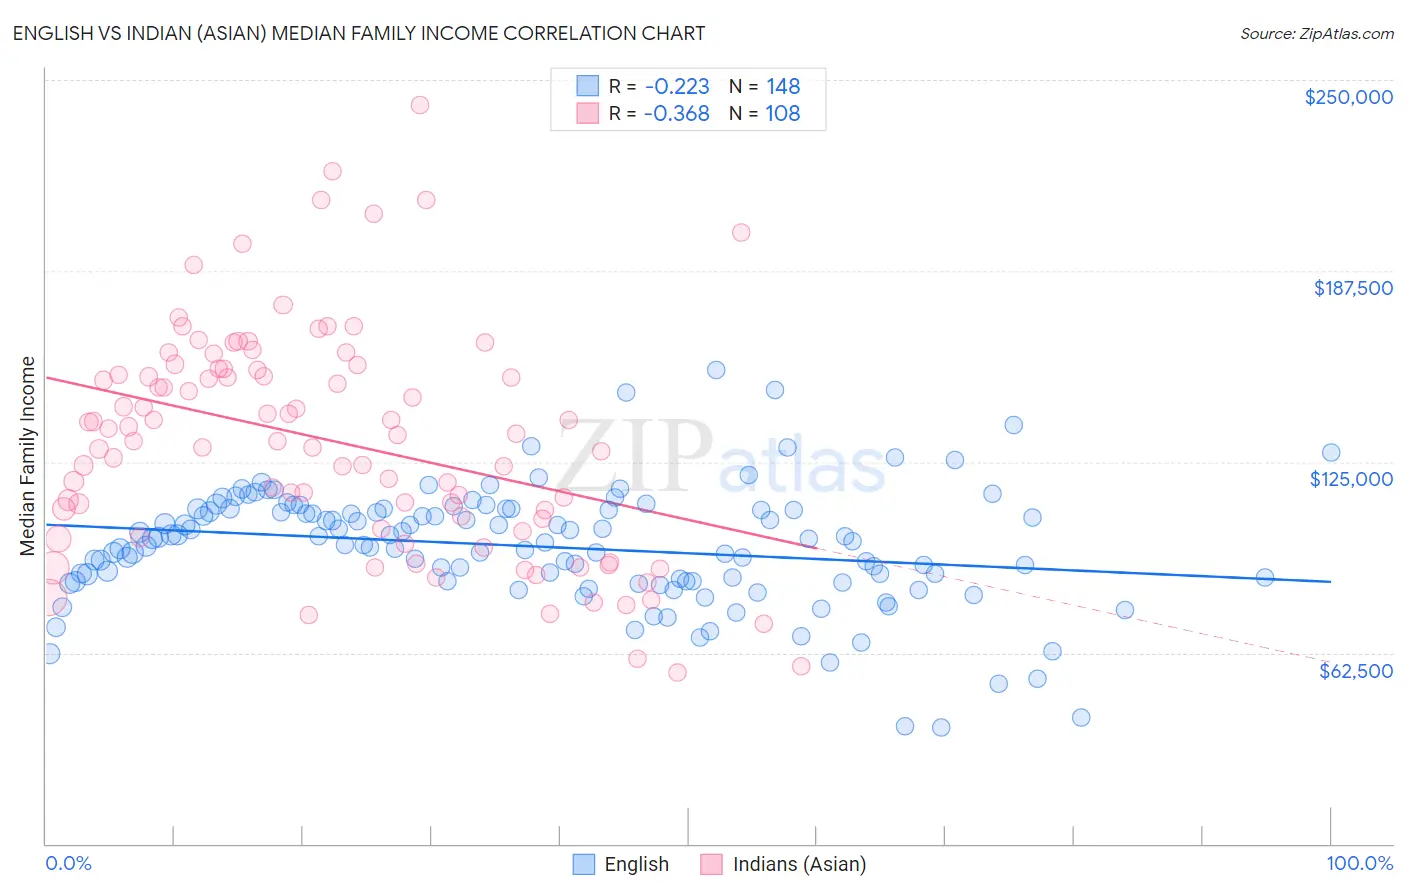
English vs Indian (Asian) Median Family Income Correlation Chart
The statistical analysis conducted on geographies consisting of 578,007,512 people shows a weak negative correlation between the proportion of English and median family income in the United States with a correlation coefficient (R) of -0.223 and weighted average of $103,684. Similarly, the statistical analysis conducted on geographies consisting of 494,431,104 people shows a mild negative correlation between the proportion of Indians (Asian) and median family income in the United States with a correlation coefficient (R) of -0.368 and weighted average of $125,312, a difference of 20.9%.
Median Family Income Correlation Summary
| Measurement | English | Indian (Asian) |
| Minimum | $37,941 | $56,023 |
| Maximum | $155,034 | $241,763 |
| Range | $117,093 | $185,740 |
| Mean | $97,321 | $131,617 |
| Median | $99,521 | $132,818 |
| Interquartile 25% (IQ1) | $86,021 | $104,858 |
| Interquartile 75% (IQ3) | $109,417 | $155,124 |
| Interquartile Range (IQR) | $23,396 | $50,266 |
| Standard Deviation (Sample) | $19,404 | $36,827 |
| Standard Deviation (Population) | $19,339 | $36,656 |
Similar Demographics by Median Family Income
Demographics Similar to English by Median Family Income
In terms of median family income, the demographic groups most similar to English are Slovak ($103,729, a difference of 0.040%), South American Indian ($103,624, a difference of 0.060%), Immigrants from Peru ($103,534, a difference of 0.15%), Sierra Leonean ($103,859, a difference of 0.17%), and Immigrants from Sierra Leone ($103,990, a difference of 0.29%).
| Demographics | Rating | Rank | Median Family Income |
| Swiss | 70.7 /100 | #159 | Good $104,396 |
| Scottish | 69.5 /100 | #160 | Good $104,288 |
| Icelanders | 69.4 /100 | #161 | Good $104,282 |
| Immigrants | Sierra Leone | 66.2 /100 | #162 | Good $103,990 |
| Costa Ricans | 66.2 /100 | #163 | Good $103,989 |
| Sierra Leoneans | 64.7 /100 | #164 | Good $103,859 |
| Slovaks | 63.1 /100 | #165 | Good $103,729 |
| English | 62.6 /100 | #166 | Good $103,684 |
| South American Indians | 61.9 /100 | #167 | Good $103,624 |
| Immigrants | Peru | 60.8 /100 | #168 | Good $103,534 |
| Czechoslovakians | 57.6 /100 | #169 | Average $103,273 |
| Immigrants | Uzbekistan | 56.6 /100 | #170 | Average $103,197 |
| Alsatians | 54.3 /100 | #171 | Average $103,010 |
| Immigrants | Eritrea | 51.9 /100 | #172 | Average $102,823 |
| Belgians | 51.4 /100 | #173 | Average $102,788 |
Demographics Similar to Indians (Asian) by Median Family Income
In terms of median family income, the demographic groups most similar to Indians (Asian) are Immigrants from Eastern Asia ($125,150, a difference of 0.13%), Immigrants from China ($125,540, a difference of 0.18%), Eastern European ($125,546, a difference of 0.19%), Immigrants from South Central Asia ($125,956, a difference of 0.51%), and Immigrants from Australia ($126,620, a difference of 1.0%).
| Demographics | Rating | Rank | Median Family Income |
| Immigrants | Ireland | 100.0 /100 | #10 | Exceptional $127,584 |
| Immigrants | Israel | 100.0 /100 | #11 | Exceptional $127,430 |
| Cypriots | 100.0 /100 | #12 | Exceptional $127,064 |
| Immigrants | Australia | 100.0 /100 | #13 | Exceptional $126,620 |
| Immigrants | South Central Asia | 100.0 /100 | #14 | Exceptional $125,956 |
| Eastern Europeans | 100.0 /100 | #15 | Exceptional $125,546 |
| Immigrants | China | 100.0 /100 | #16 | Exceptional $125,540 |
| Indians (Asian) | 100.0 /100 | #17 | Exceptional $125,312 |
| Immigrants | Eastern Asia | 100.0 /100 | #18 | Exceptional $125,150 |
| Immigrants | Belgium | 100.0 /100 | #19 | Exceptional $123,831 |
| Burmese | 100.0 /100 | #20 | Exceptional $123,369 |
| Immigrants | Korea | 100.0 /100 | #21 | Exceptional $122,800 |
| Immigrants | Sweden | 100.0 /100 | #22 | Exceptional $122,765 |
| Immigrants | Japan | 100.0 /100 | #23 | Exceptional $122,764 |
| Immigrants | Northern Europe | 100.0 /100 | #24 | Exceptional $121,840 |