English vs Immigrants from Morocco Median Family Income
COMPARE
English
Immigrants from Morocco
Median Family Income
Median Family Income Comparison
English
Immigrants from Morocco
$103,684
MEDIAN FAMILY INCOME
62.6/ 100
METRIC RATING
166th/ 347
METRIC RANK
$105,964
MEDIAN FAMILY INCOME
84.3/ 100
METRIC RATING
144th/ 347
METRIC RANK
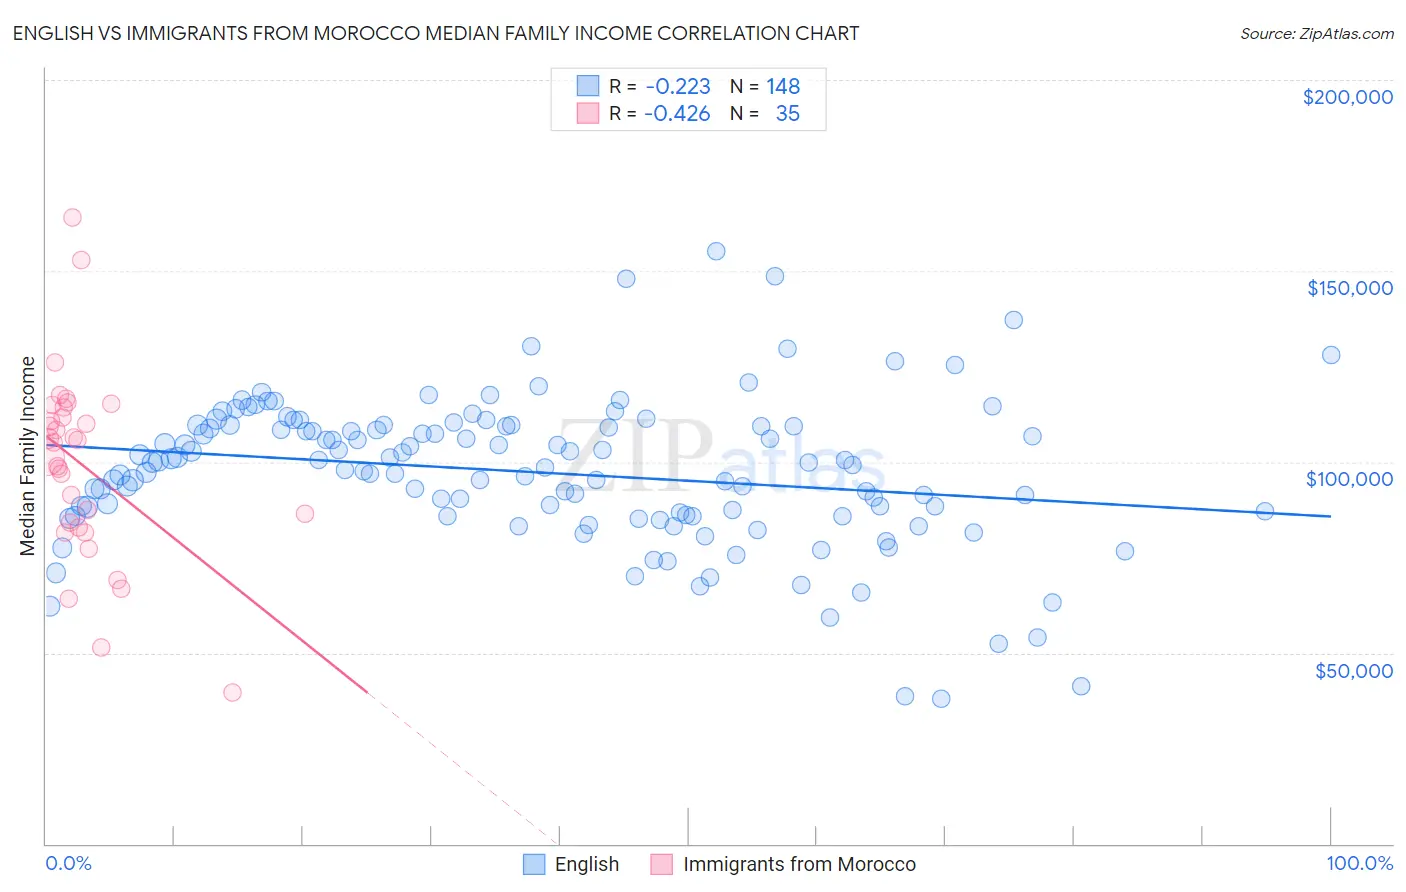
English vs Immigrants from Morocco Median Family Income Correlation Chart
The statistical analysis conducted on geographies consisting of 578,007,512 people shows a weak negative correlation between the proportion of English and median family income in the United States with a correlation coefficient (R) of -0.223 and weighted average of $103,684. Similarly, the statistical analysis conducted on geographies consisting of 178,905,802 people shows a moderate negative correlation between the proportion of Immigrants from Morocco and median family income in the United States with a correlation coefficient (R) of -0.426 and weighted average of $105,964, a difference of 2.2%.
Median Family Income Correlation Summary
| Measurement | English | Immigrants from Morocco |
| Minimum | $37,941 | $39,712 |
| Maximum | $155,034 | $163,880 |
| Range | $117,093 | $124,168 |
| Mean | $97,321 | $99,080 |
| Median | $99,521 | $105,156 |
| Interquartile 25% (IQ1) | $86,021 | $82,830 |
| Interquartile 75% (IQ3) | $109,417 | $114,323 |
| Interquartile Range (IQR) | $23,396 | $31,493 |
| Standard Deviation (Sample) | $19,404 | $24,961 |
| Standard Deviation (Population) | $19,339 | $24,602 |
Similar Demographics by Median Family Income
Demographics Similar to English by Median Family Income
In terms of median family income, the demographic groups most similar to English are Slovak ($103,729, a difference of 0.040%), South American Indian ($103,624, a difference of 0.060%), Immigrants from Peru ($103,534, a difference of 0.15%), Sierra Leonean ($103,859, a difference of 0.17%), and Immigrants from Sierra Leone ($103,990, a difference of 0.29%).
| Demographics | Rating | Rank | Median Family Income |
| Swiss | 70.7 /100 | #159 | Good $104,396 |
| Scottish | 69.5 /100 | #160 | Good $104,288 |
| Icelanders | 69.4 /100 | #161 | Good $104,282 |
| Immigrants | Sierra Leone | 66.2 /100 | #162 | Good $103,990 |
| Costa Ricans | 66.2 /100 | #163 | Good $103,989 |
| Sierra Leoneans | 64.7 /100 | #164 | Good $103,859 |
| Slovaks | 63.1 /100 | #165 | Good $103,729 |
| English | 62.6 /100 | #166 | Good $103,684 |
| South American Indians | 61.9 /100 | #167 | Good $103,624 |
| Immigrants | Peru | 60.8 /100 | #168 | Good $103,534 |
| Czechoslovakians | 57.6 /100 | #169 | Average $103,273 |
| Immigrants | Uzbekistan | 56.6 /100 | #170 | Average $103,197 |
| Alsatians | 54.3 /100 | #171 | Average $103,010 |
| Immigrants | Eritrea | 51.9 /100 | #172 | Average $102,823 |
| Belgians | 51.4 /100 | #173 | Average $102,788 |
Demographics Similar to Immigrants from Morocco by Median Family Income
In terms of median family income, the demographic groups most similar to Immigrants from Morocco are Tongan ($105,967, a difference of 0.0%), Slovene ($106,020, a difference of 0.050%), Danish ($105,900, a difference of 0.060%), Czech ($105,839, a difference of 0.12%), and Immigrants from Syria ($106,118, a difference of 0.15%).
| Demographics | Rating | Rank | Median Family Income |
| Immigrants | Uganda | 85.7 /100 | #137 | Excellent $106,188 |
| Immigrants | Vietnam | 85.7 /100 | #138 | Excellent $106,186 |
| Luxembourgers | 85.7 /100 | #139 | Excellent $106,183 |
| Norwegians | 85.5 /100 | #140 | Excellent $106,144 |
| Immigrants | Syria | 85.3 /100 | #141 | Excellent $106,118 |
| Slovenes | 84.7 /100 | #142 | Excellent $106,020 |
| Tongans | 84.3 /100 | #143 | Excellent $105,967 |
| Immigrants | Morocco | 84.3 /100 | #144 | Excellent $105,964 |
| Danes | 83.8 /100 | #145 | Excellent $105,900 |
| Czechs | 83.4 /100 | #146 | Excellent $105,839 |
| Immigrants | Chile | 82.1 /100 | #147 | Excellent $105,655 |
| Hungarians | 81.7 /100 | #148 | Excellent $105,609 |
| Immigrants | Germany | 80.9 /100 | #149 | Excellent $105,507 |
| Irish | 80.5 /100 | #150 | Excellent $105,453 |
| Peruvians | 80.4 /100 | #151 | Excellent $105,444 |