English vs Immigrants from West Indies Median Family Income
COMPARE
English
Immigrants from West Indies
Median Family Income
Median Family Income Comparison
English
Immigrants from West Indies
$103,684
MEDIAN FAMILY INCOME
62.6/ 100
METRIC RATING
166th/ 347
METRIC RANK
$91,588
MEDIAN FAMILY INCOME
0.3/ 100
METRIC RATING
263rd/ 347
METRIC RANK
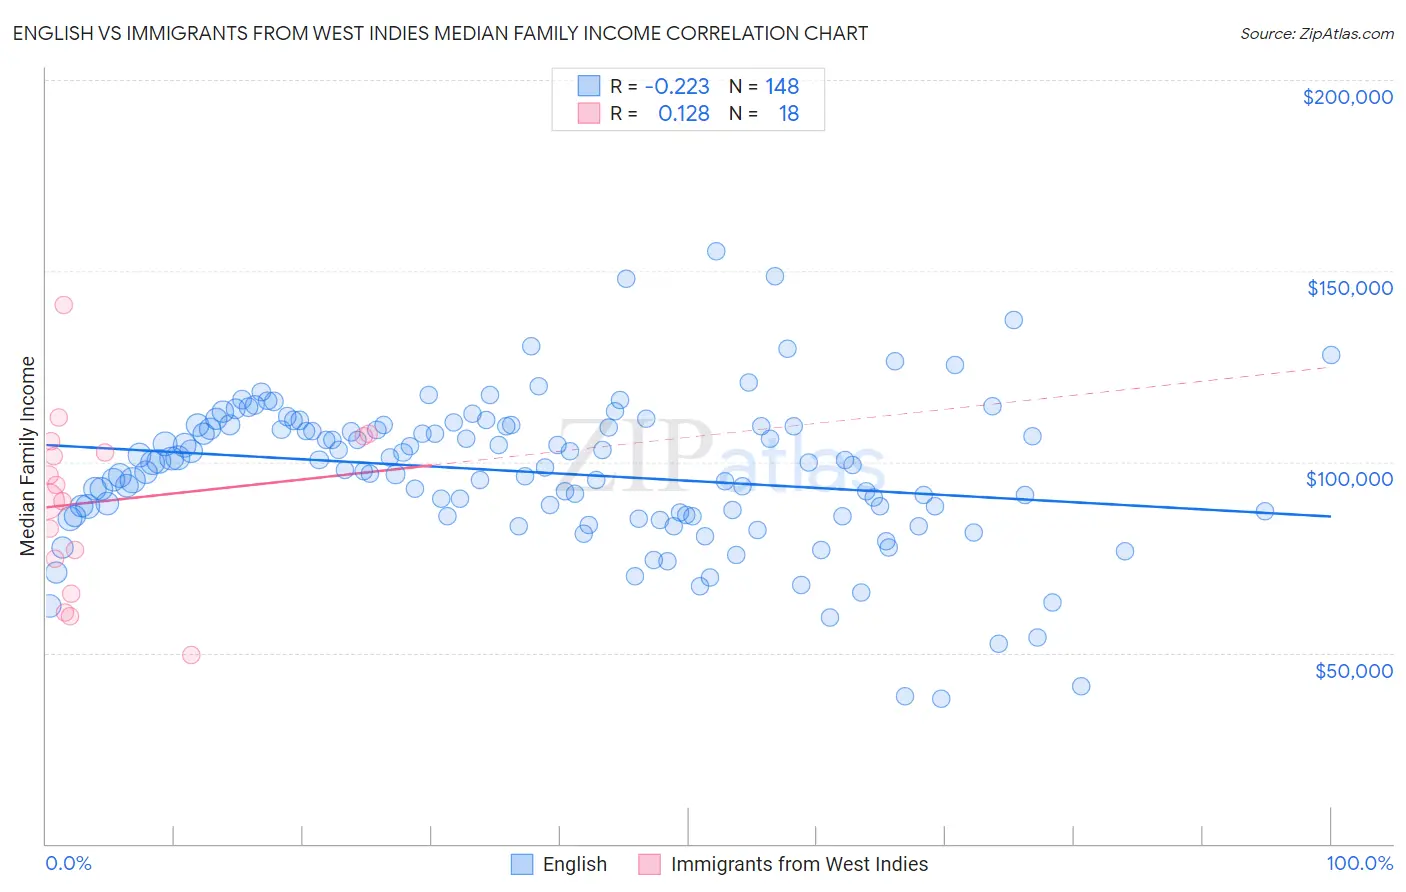
English vs Immigrants from West Indies Median Family Income Correlation Chart
The statistical analysis conducted on geographies consisting of 578,007,512 people shows a weak negative correlation between the proportion of English and median family income in the United States with a correlation coefficient (R) of -0.223 and weighted average of $103,684. Similarly, the statistical analysis conducted on geographies consisting of 72,412,445 people shows a poor positive correlation between the proportion of Immigrants from West Indies and median family income in the United States with a correlation coefficient (R) of 0.128 and weighted average of $91,588, a difference of 13.2%.
Median Family Income Correlation Summary
| Measurement | English | Immigrants from West Indies |
| Minimum | $37,941 | $49,539 |
| Maximum | $155,034 | $141,054 |
| Range | $117,093 | $91,515 |
| Mean | $97,321 | $89,730 |
| Median | $99,521 | $91,813 |
| Interquartile 25% (IQ1) | $86,021 | $74,771 |
| Interquartile 75% (IQ3) | $109,417 | $105,524 |
| Interquartile Range (IQR) | $23,396 | $30,753 |
| Standard Deviation (Sample) | $19,404 | $22,647 |
| Standard Deviation (Population) | $19,339 | $22,009 |
Similar Demographics by Median Family Income
Demographics Similar to English by Median Family Income
In terms of median family income, the demographic groups most similar to English are Slovak ($103,729, a difference of 0.040%), South American Indian ($103,624, a difference of 0.060%), Immigrants from Peru ($103,534, a difference of 0.15%), Sierra Leonean ($103,859, a difference of 0.17%), and Immigrants from Sierra Leone ($103,990, a difference of 0.29%).
| Demographics | Rating | Rank | Median Family Income |
| Swiss | 70.7 /100 | #159 | Good $104,396 |
| Scottish | 69.5 /100 | #160 | Good $104,288 |
| Icelanders | 69.4 /100 | #161 | Good $104,282 |
| Immigrants | Sierra Leone | 66.2 /100 | #162 | Good $103,990 |
| Costa Ricans | 66.2 /100 | #163 | Good $103,989 |
| Sierra Leoneans | 64.7 /100 | #164 | Good $103,859 |
| Slovaks | 63.1 /100 | #165 | Good $103,729 |
| English | 62.6 /100 | #166 | Good $103,684 |
| South American Indians | 61.9 /100 | #167 | Good $103,624 |
| Immigrants | Peru | 60.8 /100 | #168 | Good $103,534 |
| Czechoslovakians | 57.6 /100 | #169 | Average $103,273 |
| Immigrants | Uzbekistan | 56.6 /100 | #170 | Average $103,197 |
| Alsatians | 54.3 /100 | #171 | Average $103,010 |
| Immigrants | Eritrea | 51.9 /100 | #172 | Average $102,823 |
| Belgians | 51.4 /100 | #173 | Average $102,788 |
Demographics Similar to Immigrants from West Indies by Median Family Income
In terms of median family income, the demographic groups most similar to Immigrants from West Indies are Senegalese ($91,475, a difference of 0.12%), Liberian ($91,722, a difference of 0.15%), Inupiat ($91,730, a difference of 0.16%), Pennsylvania German ($91,763, a difference of 0.19%), and Cape Verdean ($91,848, a difference of 0.28%).
| Demographics | Rating | Rank | Median Family Income |
| Nicaraguans | 0.5 /100 | #256 | Tragic $92,231 |
| Americans | 0.4 /100 | #257 | Tragic $92,096 |
| Osage | 0.4 /100 | #258 | Tragic $91,926 |
| Cape Verdeans | 0.4 /100 | #259 | Tragic $91,848 |
| Pennsylvania Germans | 0.4 /100 | #260 | Tragic $91,763 |
| Inupiat | 0.4 /100 | #261 | Tragic $91,730 |
| Liberians | 0.4 /100 | #262 | Tragic $91,722 |
| Immigrants | West Indies | 0.3 /100 | #263 | Tragic $91,588 |
| Senegalese | 0.3 /100 | #264 | Tragic $91,475 |
| Hmong | 0.3 /100 | #265 | Tragic $91,296 |
| Central Americans | 0.3 /100 | #266 | Tragic $91,087 |
| Mexican American Indians | 0.2 /100 | #267 | Tragic $90,918 |
| Cree | 0.2 /100 | #268 | Tragic $90,882 |
| Belizeans | 0.2 /100 | #269 | Tragic $90,880 |
| Jamaicans | 0.2 /100 | #270 | Tragic $90,581 |