English vs Immigrants from Ethiopia Median Family Income
COMPARE
English
Immigrants from Ethiopia
Median Family Income
Median Family Income Comparison
English
Immigrants from Ethiopia
$103,684
MEDIAN FAMILY INCOME
62.6/ 100
METRIC RATING
166th/ 347
METRIC RANK
$106,969
MEDIAN FAMILY INCOME
90.0/ 100
METRIC RATING
128th/ 347
METRIC RANK
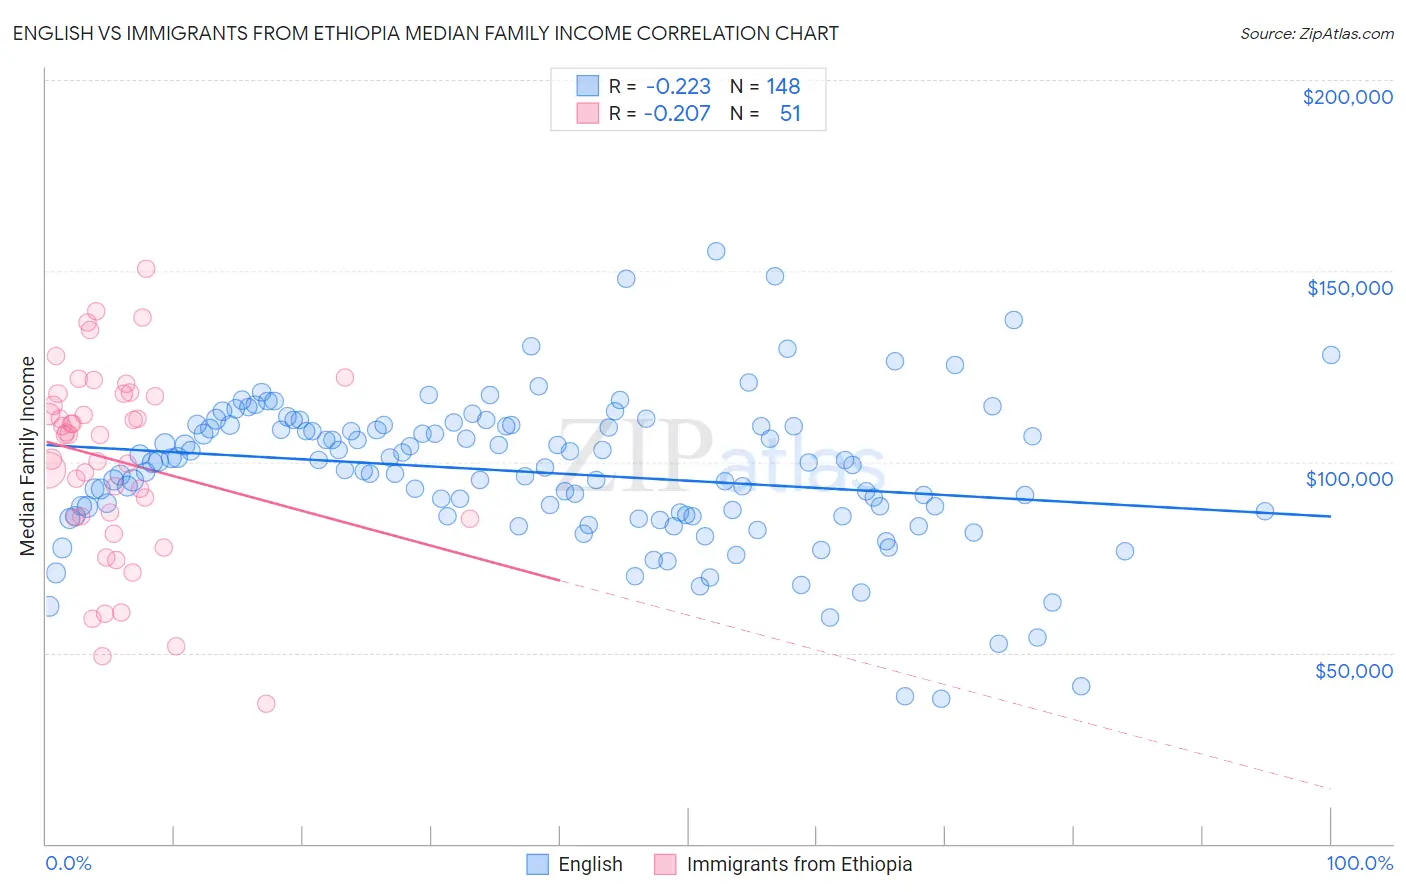
English vs Immigrants from Ethiopia Median Family Income Correlation Chart
The statistical analysis conducted on geographies consisting of 578,007,512 people shows a weak negative correlation between the proportion of English and median family income in the United States with a correlation coefficient (R) of -0.223 and weighted average of $103,684. Similarly, the statistical analysis conducted on geographies consisting of 211,422,914 people shows a weak negative correlation between the proportion of Immigrants from Ethiopia and median family income in the United States with a correlation coefficient (R) of -0.207 and weighted average of $106,969, a difference of 3.2%.
Median Family Income Correlation Summary
| Measurement | English | Immigrants from Ethiopia |
| Minimum | $37,941 | $36,544 |
| Maximum | $155,034 | $150,528 |
| Range | $117,093 | $113,984 |
| Mean | $97,321 | $100,429 |
| Median | $99,521 | $107,133 |
| Interquartile 25% (IQ1) | $86,021 | $85,358 |
| Interquartile 75% (IQ3) | $109,417 | $117,899 |
| Interquartile Range (IQR) | $23,396 | $32,541 |
| Standard Deviation (Sample) | $19,404 | $24,958 |
| Standard Deviation (Population) | $19,339 | $24,712 |
Similar Demographics by Median Family Income
Demographics Similar to English by Median Family Income
In terms of median family income, the demographic groups most similar to English are Slovak ($103,729, a difference of 0.040%), South American Indian ($103,624, a difference of 0.060%), Immigrants from Peru ($103,534, a difference of 0.15%), Sierra Leonean ($103,859, a difference of 0.17%), and Immigrants from Sierra Leone ($103,990, a difference of 0.29%).
| Demographics | Rating | Rank | Median Family Income |
| Swiss | 70.7 /100 | #159 | Good $104,396 |
| Scottish | 69.5 /100 | #160 | Good $104,288 |
| Icelanders | 69.4 /100 | #161 | Good $104,282 |
| Immigrants | Sierra Leone | 66.2 /100 | #162 | Good $103,990 |
| Costa Ricans | 66.2 /100 | #163 | Good $103,989 |
| Sierra Leoneans | 64.7 /100 | #164 | Good $103,859 |
| Slovaks | 63.1 /100 | #165 | Good $103,729 |
| English | 62.6 /100 | #166 | Good $103,684 |
| South American Indians | 61.9 /100 | #167 | Good $103,624 |
| Immigrants | Peru | 60.8 /100 | #168 | Good $103,534 |
| Czechoslovakians | 57.6 /100 | #169 | Average $103,273 |
| Immigrants | Uzbekistan | 56.6 /100 | #170 | Average $103,197 |
| Alsatians | 54.3 /100 | #171 | Average $103,010 |
| Immigrants | Eritrea | 51.9 /100 | #172 | Average $102,823 |
| Belgians | 51.4 /100 | #173 | Average $102,788 |
Demographics Similar to Immigrants from Ethiopia by Median Family Income
In terms of median family income, the demographic groups most similar to Immigrants from Ethiopia are Arab ($106,952, a difference of 0.020%), Brazilian ($106,942, a difference of 0.030%), Lebanese ($107,086, a difference of 0.11%), Serbian ($107,157, a difference of 0.18%), and Taiwanese ($107,295, a difference of 0.30%).
| Demographics | Rating | Rank | Median Family Income |
| Europeans | 94.1 /100 | #121 | Exceptional $108,099 |
| Immigrants | Jordan | 92.9 /100 | #122 | Exceptional $107,715 |
| Carpatho Rusyns | 92.2 /100 | #123 | Exceptional $107,502 |
| Pakistanis | 91.7 /100 | #124 | Exceptional $107,390 |
| Taiwanese | 91.4 /100 | #125 | Exceptional $107,295 |
| Serbians | 90.8 /100 | #126 | Exceptional $107,157 |
| Lebanese | 90.5 /100 | #127 | Exceptional $107,086 |
| Immigrants | Ethiopia | 90.0 /100 | #128 | Excellent $106,969 |
| Arabs | 89.9 /100 | #129 | Excellent $106,952 |
| Brazilians | 89.8 /100 | #130 | Excellent $106,942 |
| Canadians | 88.1 /100 | #131 | Excellent $106,597 |
| Immigrants | Fiji | 87.8 /100 | #132 | Excellent $106,544 |
| Ugandans | 87.8 /100 | #133 | Excellent $106,541 |
| Immigrants | Oceania | 87.3 /100 | #134 | Excellent $106,453 |
| Portuguese | 86.3 /100 | #135 | Excellent $106,286 |