Somali vs Immigrants from West Indies Median Family Income
COMPARE
Somali
Immigrants from West Indies
Median Family Income
Median Family Income Comparison
Somalis
Immigrants from West Indies
$94,085
MEDIAN FAMILY INCOME
1.2/ 100
METRIC RATING
240th/ 347
METRIC RANK
$91,588
MEDIAN FAMILY INCOME
0.3/ 100
METRIC RATING
263rd/ 347
METRIC RANK
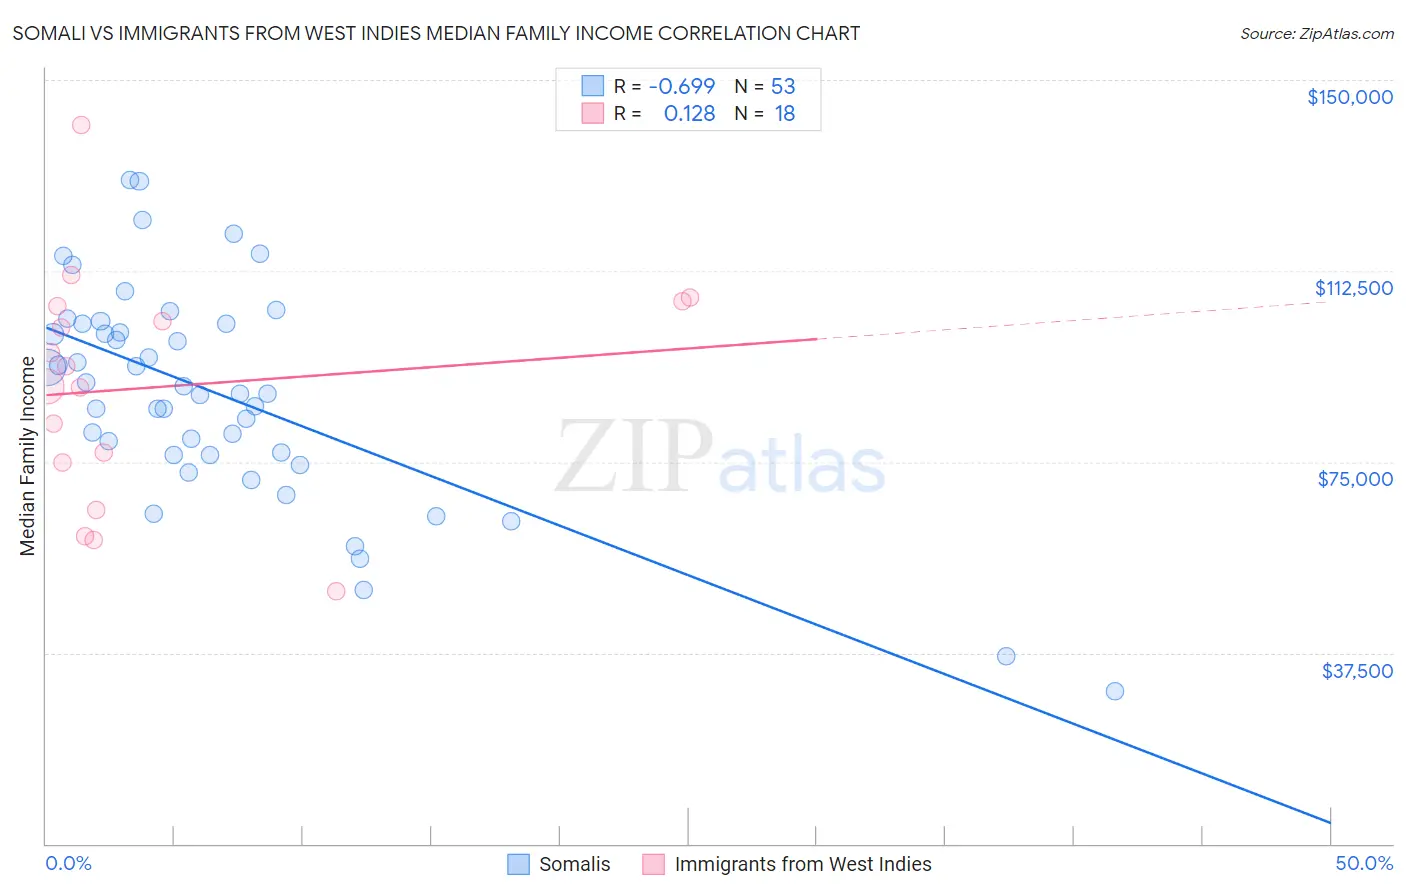
Somali vs Immigrants from West Indies Median Family Income Correlation Chart
The statistical analysis conducted on geographies consisting of 99,278,232 people shows a significant negative correlation between the proportion of Somalis and median family income in the United States with a correlation coefficient (R) of -0.699 and weighted average of $94,085. Similarly, the statistical analysis conducted on geographies consisting of 72,412,445 people shows a poor positive correlation between the proportion of Immigrants from West Indies and median family income in the United States with a correlation coefficient (R) of 0.128 and weighted average of $91,588, a difference of 2.7%.
Median Family Income Correlation Summary
| Measurement | Somali | Immigrants from West Indies |
| Minimum | $29,978 | $49,539 |
| Maximum | $130,246 | $141,054 |
| Range | $100,268 | $91,515 |
| Mean | $88,236 | $89,730 |
| Median | $88,476 | $91,813 |
| Interquartile 25% (IQ1) | $76,386 | $74,771 |
| Interquartile 75% (IQ3) | $102,172 | $105,524 |
| Interquartile Range (IQR) | $25,786 | $30,753 |
| Standard Deviation (Sample) | $21,250 | $22,647 |
| Standard Deviation (Population) | $21,049 | $22,009 |
Similar Demographics by Median Family Income
Demographics Similar to Somalis by Median Family Income
In terms of median family income, the demographic groups most similar to Somalis are Salvadoran ($94,109, a difference of 0.030%), Nepalese ($94,153, a difference of 0.070%), Immigrants from Trinidad and Tobago ($93,988, a difference of 0.10%), Barbadian ($93,919, a difference of 0.18%), and German Russian ($93,858, a difference of 0.24%).
| Demographics | Rating | Rank | Median Family Income |
| Immigrants | Bangladesh | 1.6 /100 | #233 | Tragic $94,665 |
| Immigrants | Western Africa | 1.6 /100 | #234 | Tragic $94,638 |
| Immigrants | Burma/Myanmar | 1.5 /100 | #235 | Tragic $94,472 |
| Trinidadians and Tobagonians | 1.5 /100 | #236 | Tragic $94,466 |
| Alaskan Athabascans | 1.5 /100 | #237 | Tragic $94,429 |
| Nepalese | 1.3 /100 | #238 | Tragic $94,153 |
| Salvadorans | 1.2 /100 | #239 | Tragic $94,109 |
| Somalis | 1.2 /100 | #240 | Tragic $94,085 |
| Immigrants | Trinidad and Tobago | 1.2 /100 | #241 | Tragic $93,988 |
| Barbadians | 1.1 /100 | #242 | Tragic $93,919 |
| German Russians | 1.1 /100 | #243 | Tragic $93,858 |
| Sub-Saharan Africans | 1.0 /100 | #244 | Tragic $93,748 |
| Immigrants | Middle Africa | 1.0 /100 | #245 | Tragic $93,593 |
| Guyanese | 0.9 /100 | #246 | Tragic $93,373 |
| Immigrants | Senegal | 0.7 /100 | #247 | Tragic $92,912 |
Demographics Similar to Immigrants from West Indies by Median Family Income
In terms of median family income, the demographic groups most similar to Immigrants from West Indies are Senegalese ($91,475, a difference of 0.12%), Liberian ($91,722, a difference of 0.15%), Inupiat ($91,730, a difference of 0.16%), Pennsylvania German ($91,763, a difference of 0.19%), and Cape Verdean ($91,848, a difference of 0.28%).
| Demographics | Rating | Rank | Median Family Income |
| Nicaraguans | 0.5 /100 | #256 | Tragic $92,231 |
| Americans | 0.4 /100 | #257 | Tragic $92,096 |
| Osage | 0.4 /100 | #258 | Tragic $91,926 |
| Cape Verdeans | 0.4 /100 | #259 | Tragic $91,848 |
| Pennsylvania Germans | 0.4 /100 | #260 | Tragic $91,763 |
| Inupiat | 0.4 /100 | #261 | Tragic $91,730 |
| Liberians | 0.4 /100 | #262 | Tragic $91,722 |
| Immigrants | West Indies | 0.3 /100 | #263 | Tragic $91,588 |
| Senegalese | 0.3 /100 | #264 | Tragic $91,475 |
| Hmong | 0.3 /100 | #265 | Tragic $91,296 |
| Central Americans | 0.3 /100 | #266 | Tragic $91,087 |
| Mexican American Indians | 0.2 /100 | #267 | Tragic $90,918 |
| Cree | 0.2 /100 | #268 | Tragic $90,882 |
| Belizeans | 0.2 /100 | #269 | Tragic $90,880 |
| Jamaicans | 0.2 /100 | #270 | Tragic $90,581 |