Immigrants from Trinidad and Tobago vs Immigrants from Morocco Median Family Income
COMPARE
Immigrants from Trinidad and Tobago
Immigrants from Morocco
Median Family Income
Median Family Income Comparison
Immigrants from Trinidad and Tobago
Immigrants from Morocco
$93,988
MEDIAN FAMILY INCOME
1.2/ 100
METRIC RATING
241st/ 347
METRIC RANK
$105,964
MEDIAN FAMILY INCOME
84.3/ 100
METRIC RATING
144th/ 347
METRIC RANK
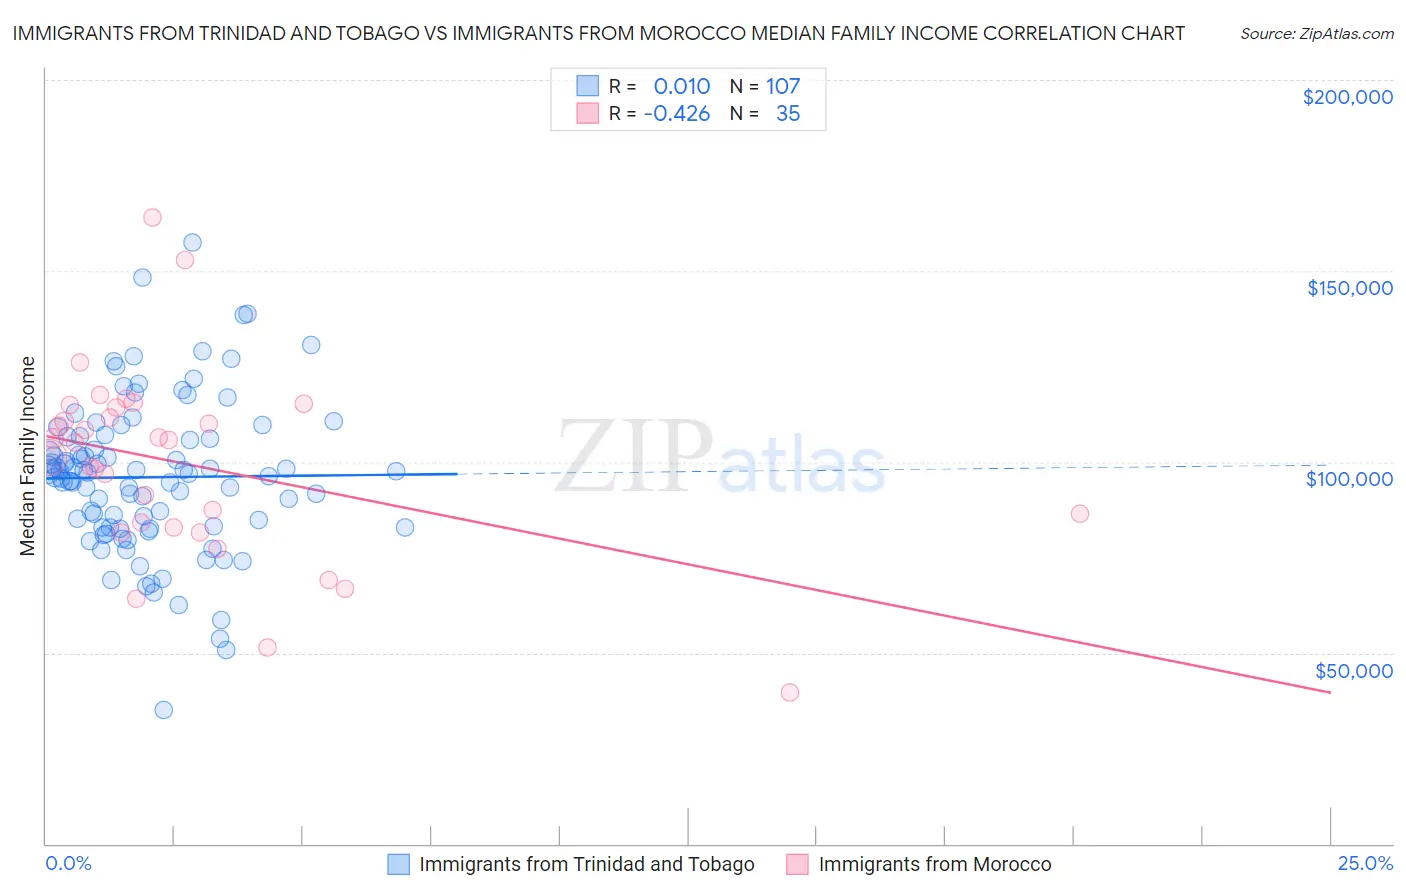
Immigrants from Trinidad and Tobago vs Immigrants from Morocco Median Family Income Correlation Chart
The statistical analysis conducted on geographies consisting of 223,463,571 people shows no correlation between the proportion of Immigrants from Trinidad and Tobago and median family income in the United States with a correlation coefficient (R) of 0.010 and weighted average of $93,988. Similarly, the statistical analysis conducted on geographies consisting of 178,905,802 people shows a moderate negative correlation between the proportion of Immigrants from Morocco and median family income in the United States with a correlation coefficient (R) of -0.426 and weighted average of $105,964, a difference of 12.7%.
Median Family Income Correlation Summary
| Measurement | Immigrants from Trinidad and Tobago | Immigrants from Morocco |
| Minimum | $35,148 | $39,712 |
| Maximum | $157,500 | $163,880 |
| Range | $122,352 | $124,168 |
| Mean | $95,978 | $99,080 |
| Median | $96,780 | $105,156 |
| Interquartile 25% (IQ1) | $82,831 | $82,830 |
| Interquartile 75% (IQ3) | $106,554 | $114,323 |
| Interquartile Range (IQR) | $23,723 | $31,493 |
| Standard Deviation (Sample) | $20,068 | $24,961 |
| Standard Deviation (Population) | $19,974 | $24,602 |
Similar Demographics by Median Family Income
Demographics Similar to Immigrants from Trinidad and Tobago by Median Family Income
In terms of median family income, the demographic groups most similar to Immigrants from Trinidad and Tobago are Barbadian ($93,919, a difference of 0.070%), Somali ($94,085, a difference of 0.10%), Salvadoran ($94,109, a difference of 0.13%), German Russian ($93,858, a difference of 0.14%), and Nepalese ($94,153, a difference of 0.17%).
| Demographics | Rating | Rank | Median Family Income |
| Immigrants | Western Africa | 1.6 /100 | #234 | Tragic $94,638 |
| Immigrants | Burma/Myanmar | 1.5 /100 | #235 | Tragic $94,472 |
| Trinidadians and Tobagonians | 1.5 /100 | #236 | Tragic $94,466 |
| Alaskan Athabascans | 1.5 /100 | #237 | Tragic $94,429 |
| Nepalese | 1.3 /100 | #238 | Tragic $94,153 |
| Salvadorans | 1.2 /100 | #239 | Tragic $94,109 |
| Somalis | 1.2 /100 | #240 | Tragic $94,085 |
| Immigrants | Trinidad and Tobago | 1.2 /100 | #241 | Tragic $93,988 |
| Barbadians | 1.1 /100 | #242 | Tragic $93,919 |
| German Russians | 1.1 /100 | #243 | Tragic $93,858 |
| Sub-Saharan Africans | 1.0 /100 | #244 | Tragic $93,748 |
| Immigrants | Middle Africa | 1.0 /100 | #245 | Tragic $93,593 |
| Guyanese | 0.9 /100 | #246 | Tragic $93,373 |
| Immigrants | Senegal | 0.7 /100 | #247 | Tragic $92,912 |
| French American Indians | 0.7 /100 | #248 | Tragic $92,872 |
Demographics Similar to Immigrants from Morocco by Median Family Income
In terms of median family income, the demographic groups most similar to Immigrants from Morocco are Tongan ($105,967, a difference of 0.0%), Slovene ($106,020, a difference of 0.050%), Danish ($105,900, a difference of 0.060%), Czech ($105,839, a difference of 0.12%), and Immigrants from Syria ($106,118, a difference of 0.15%).
| Demographics | Rating | Rank | Median Family Income |
| Immigrants | Uganda | 85.7 /100 | #137 | Excellent $106,188 |
| Immigrants | Vietnam | 85.7 /100 | #138 | Excellent $106,186 |
| Luxembourgers | 85.7 /100 | #139 | Excellent $106,183 |
| Norwegians | 85.5 /100 | #140 | Excellent $106,144 |
| Immigrants | Syria | 85.3 /100 | #141 | Excellent $106,118 |
| Slovenes | 84.7 /100 | #142 | Excellent $106,020 |
| Tongans | 84.3 /100 | #143 | Excellent $105,967 |
| Immigrants | Morocco | 84.3 /100 | #144 | Excellent $105,964 |
| Danes | 83.8 /100 | #145 | Excellent $105,900 |
| Czechs | 83.4 /100 | #146 | Excellent $105,839 |
| Immigrants | Chile | 82.1 /100 | #147 | Excellent $105,655 |
| Hungarians | 81.7 /100 | #148 | Excellent $105,609 |
| Immigrants | Germany | 80.9 /100 | #149 | Excellent $105,507 |
| Irish | 80.5 /100 | #150 | Excellent $105,453 |
| Peruvians | 80.4 /100 | #151 | Excellent $105,444 |