Eastern European vs Immigrants from Ghana Median Family Income
COMPARE
Eastern European
Immigrants from Ghana
Median Family Income
Median Family Income Comparison
Eastern Europeans
Immigrants from Ghana
$125,546
MEDIAN FAMILY INCOME
100.0/ 100
METRIC RATING
15th/ 347
METRIC RANK
$96,544
MEDIAN FAMILY INCOME
4.2/ 100
METRIC RATING
221st/ 347
METRIC RANK
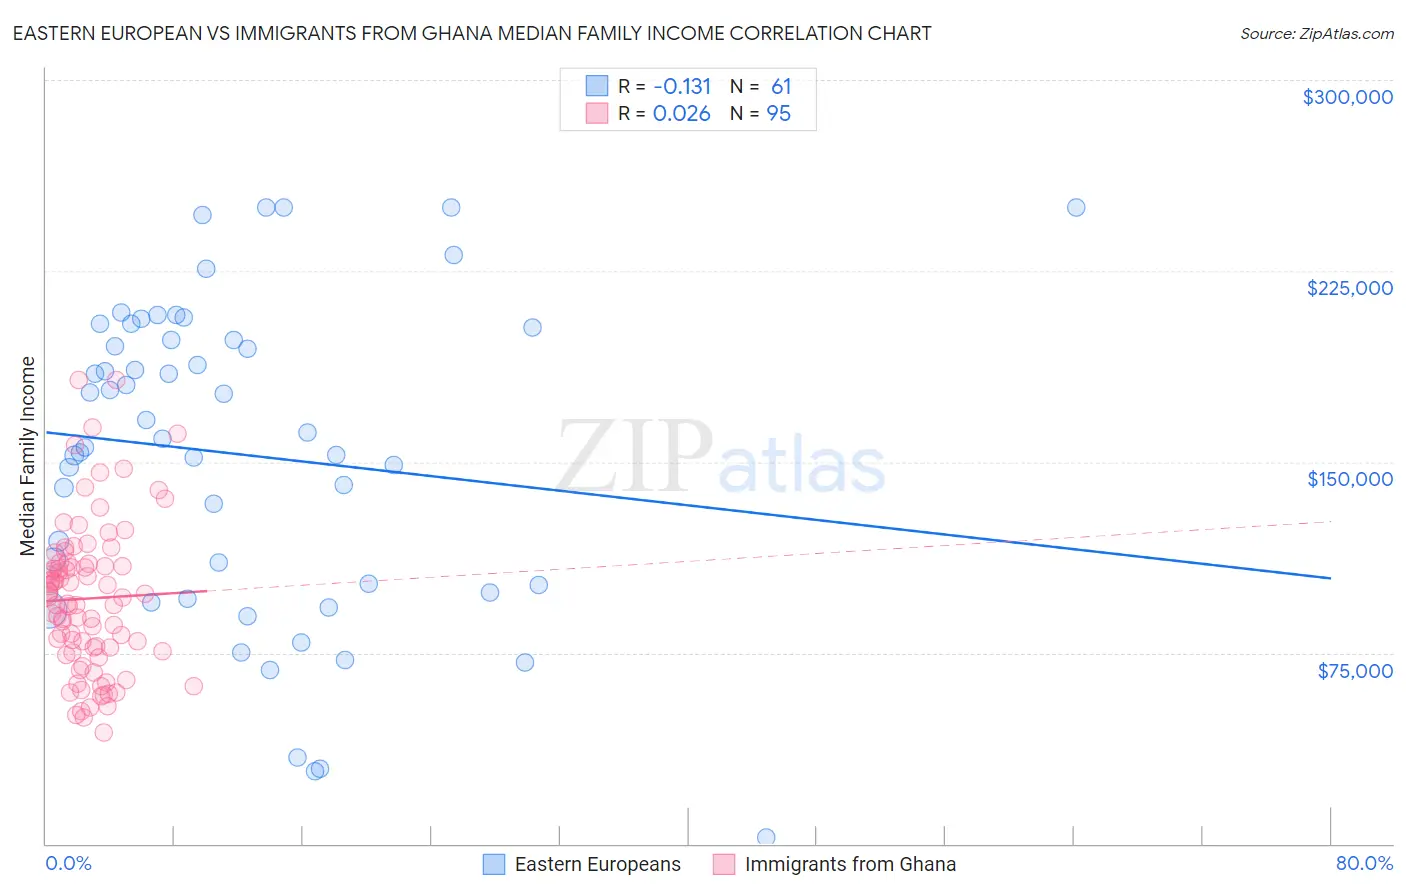
Eastern European vs Immigrants from Ghana Median Family Income Correlation Chart
The statistical analysis conducted on geographies consisting of 460,782,256 people shows a poor negative correlation between the proportion of Eastern Europeans and median family income in the United States with a correlation coefficient (R) of -0.131 and weighted average of $125,546. Similarly, the statistical analysis conducted on geographies consisting of 199,771,663 people shows no correlation between the proportion of Immigrants from Ghana and median family income in the United States with a correlation coefficient (R) of 0.026 and weighted average of $96,544, a difference of 30.0%.
Median Family Income Correlation Summary
| Measurement | Eastern European | Immigrants from Ghana |
| Minimum | $2,499 | $43,736 |
| Maximum | $250,001 | $182,203 |
| Range | $247,502 | $138,466 |
| Mean | $152,671 | $96,337 |
| Median | $158,974 | $96,719 |
| Interquartile 25% (IQ1) | $100,360 | $75,639 |
| Interquartile 75% (IQ3) | $200,154 | $110,050 |
| Interquartile Range (IQR) | $99,794 | $34,411 |
| Standard Deviation (Sample) | $61,552 | $29,276 |
| Standard Deviation (Population) | $61,045 | $29,122 |
Similar Demographics by Median Family Income
Demographics Similar to Eastern Europeans by Median Family Income
In terms of median family income, the demographic groups most similar to Eastern Europeans are Immigrants from China ($125,540, a difference of 0.0%), Indian (Asian) ($125,312, a difference of 0.19%), Immigrants from Eastern Asia ($125,150, a difference of 0.32%), Immigrants from South Central Asia ($125,956, a difference of 0.33%), and Immigrants from Australia ($126,620, a difference of 0.86%).
| Demographics | Rating | Rank | Median Family Income |
| Immigrants | Iran | 100.0 /100 | #8 | Exceptional $130,894 |
| Okinawans | 100.0 /100 | #9 | Exceptional $129,979 |
| Immigrants | Ireland | 100.0 /100 | #10 | Exceptional $127,584 |
| Immigrants | Israel | 100.0 /100 | #11 | Exceptional $127,430 |
| Cypriots | 100.0 /100 | #12 | Exceptional $127,064 |
| Immigrants | Australia | 100.0 /100 | #13 | Exceptional $126,620 |
| Immigrants | South Central Asia | 100.0 /100 | #14 | Exceptional $125,956 |
| Eastern Europeans | 100.0 /100 | #15 | Exceptional $125,546 |
| Immigrants | China | 100.0 /100 | #16 | Exceptional $125,540 |
| Indians (Asian) | 100.0 /100 | #17 | Exceptional $125,312 |
| Immigrants | Eastern Asia | 100.0 /100 | #18 | Exceptional $125,150 |
| Immigrants | Belgium | 100.0 /100 | #19 | Exceptional $123,831 |
| Burmese | 100.0 /100 | #20 | Exceptional $123,369 |
| Immigrants | Korea | 100.0 /100 | #21 | Exceptional $122,800 |
| Immigrants | Sweden | 100.0 /100 | #22 | Exceptional $122,765 |
Demographics Similar to Immigrants from Ghana by Median Family Income
In terms of median family income, the demographic groups most similar to Immigrants from Ghana are Immigrants from Nigeria ($96,439, a difference of 0.11%), Sudanese ($96,783, a difference of 0.25%), Venezuelan ($96,281, a difference of 0.27%), Nonimmigrants ($96,231, a difference of 0.33%), and Delaware ($96,958, a difference of 0.43%).
| Demographics | Rating | Rank | Median Family Income |
| Bermudans | 6.9 /100 | #214 | Tragic $97,577 |
| Nigerians | 6.7 /100 | #215 | Tragic $97,522 |
| Immigrants | Bosnia and Herzegovina | 6.4 /100 | #216 | Tragic $97,432 |
| Japanese | 6.0 /100 | #217 | Tragic $97,288 |
| Immigrants | Cambodia | 5.8 /100 | #218 | Tragic $97,222 |
| Delaware | 5.1 /100 | #219 | Tragic $96,958 |
| Sudanese | 4.7 /100 | #220 | Tragic $96,783 |
| Immigrants | Ghana | 4.2 /100 | #221 | Tragic $96,544 |
| Immigrants | Nigeria | 4.0 /100 | #222 | Tragic $96,439 |
| Venezuelans | 3.7 /100 | #223 | Tragic $96,281 |
| Immigrants | Nonimmigrants | 3.6 /100 | #224 | Tragic $96,231 |
| Vietnamese | 3.4 /100 | #225 | Tragic $96,123 |
| Immigrants | Panama | 2.7 /100 | #226 | Tragic $95,647 |
| Alaska Natives | 2.6 /100 | #227 | Tragic $95,573 |
| Immigrants | Azores | 2.4 /100 | #228 | Tragic $95,402 |