Yakama vs Chippewa Median Family Income
COMPARE
Yakama
Chippewa
Median Family Income
Median Family Income Comparison
Yakama
Chippewa
$83,932
MEDIAN FAMILY INCOME
0.0/ 100
METRIC RATING
317th/ 347
METRIC RANK
$86,852
MEDIAN FAMILY INCOME
0.0/ 100
METRIC RATING
299th/ 347
METRIC RANK
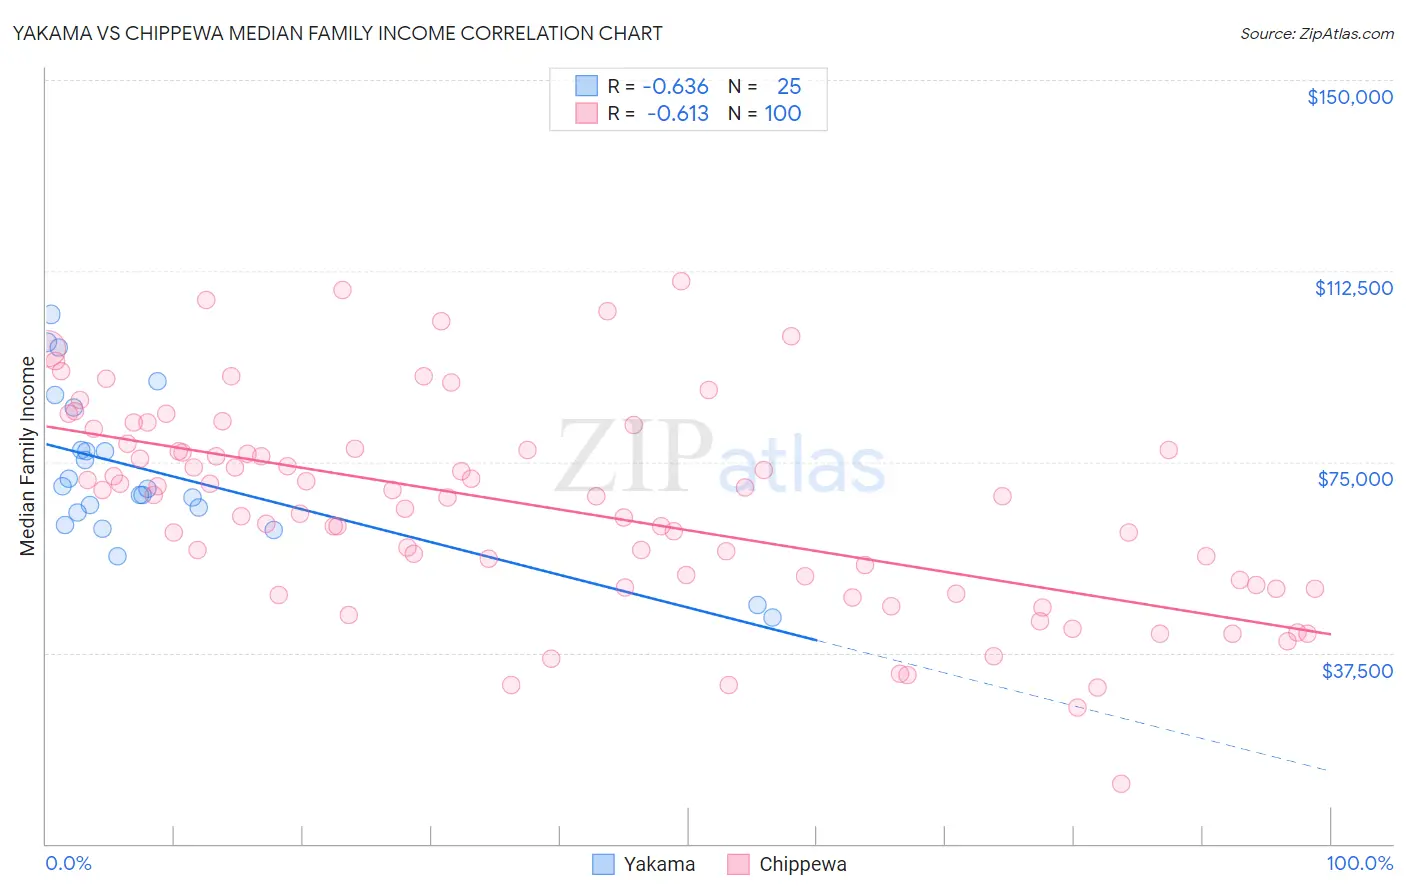
Yakama vs Chippewa Median Family Income Correlation Chart
The statistical analysis conducted on geographies consisting of 19,915,987 people shows a significant negative correlation between the proportion of Yakama and median family income in the United States with a correlation coefficient (R) of -0.636 and weighted average of $83,932. Similarly, the statistical analysis conducted on geographies consisting of 214,970,726 people shows a significant negative correlation between the proportion of Chippewa and median family income in the United States with a correlation coefficient (R) of -0.613 and weighted average of $86,852, a difference of 3.5%.
Median Family Income Correlation Summary
| Measurement | Yakama | Chippewa |
| Minimum | $44,375 | $11,667 |
| Maximum | $103,973 | $110,455 |
| Range | $59,598 | $98,788 |
| Mean | $72,774 | $65,965 |
| Median | $69,699 | $68,273 |
| Interquartile 25% (IQ1) | $63,837 | $50,598 |
| Interquartile 75% (IQ3) | $81,474 | $77,379 |
| Interquartile Range (IQR) | $17,637 | $26,781 |
| Standard Deviation (Sample) | $14,936 | $20,173 |
| Standard Deviation (Population) | $14,634 | $20,072 |
Demographics Similar to Yakama and Chippewa by Median Family Income
In terms of median family income, the demographic groups most similar to Yakama are Immigrants from Haiti ($84,018, a difference of 0.10%), Immigrants from Mexico ($83,639, a difference of 0.35%), Apache ($84,451, a difference of 0.62%), Immigrants from Bahamas ($84,732, a difference of 0.95%), and Choctaw ($84,835, a difference of 1.1%). Similarly, the demographic groups most similar to Chippewa are Immigrants from Latin America ($86,989, a difference of 0.16%), Ottawa ($86,380, a difference of 0.55%), Colville ($85,792, a difference of 1.2%), Spanish American Indian ($85,728, a difference of 1.3%), and Hispanic or Latino ($85,647, a difference of 1.4%).
| Demographics | Rating | Rank | Median Family Income |
| Immigrants | Latin America | 0.0 /100 | #298 | Tragic $86,989 |
| Chippewa | 0.0 /100 | #299 | Tragic $86,852 |
| Ottawa | 0.0 /100 | #300 | Tragic $86,380 |
| Colville | 0.0 /100 | #301 | Tragic $85,792 |
| Spanish American Indians | 0.0 /100 | #302 | Tragic $85,728 |
| Hispanics or Latinos | 0.0 /100 | #303 | Tragic $85,647 |
| Mexicans | 0.0 /100 | #304 | Tragic $85,618 |
| Paiute | 0.0 /100 | #305 | Tragic $85,414 |
| Immigrants | Dominica | 0.0 /100 | #306 | Tragic $85,411 |
| Chickasaw | 0.0 /100 | #307 | Tragic $85,356 |
| U.S. Virgin Islanders | 0.0 /100 | #308 | Tragic $85,294 |
| Haitians | 0.0 /100 | #309 | Tragic $85,218 |
| Immigrants | Central America | 0.0 /100 | #310 | Tragic $85,050 |
| Hondurans | 0.0 /100 | #311 | Tragic $85,004 |
| Cubans | 0.0 /100 | #312 | Tragic $84,981 |
| Choctaw | 0.0 /100 | #313 | Tragic $84,835 |
| Immigrants | Bahamas | 0.0 /100 | #314 | Tragic $84,732 |
| Apache | 0.0 /100 | #315 | Tragic $84,451 |
| Immigrants | Haiti | 0.0 /100 | #316 | Tragic $84,018 |
| Yakama | 0.0 /100 | #317 | Tragic $83,932 |
| Immigrants | Mexico | 0.0 /100 | #318 | Tragic $83,639 |