Creek vs Immigrants from Cabo Verde Median Male Earnings
COMPARE
Creek
Immigrants from Cabo Verde
Median Male Earnings
Median Male Earnings Comparison
Creek
Immigrants from Cabo Verde
$46,594
MEDIAN MALE EARNINGS
0.0/ 100
METRIC RATING
309th/ 347
METRIC RANK
$50,009
MEDIAN MALE EARNINGS
1.2/ 100
METRIC RATING
252nd/ 347
METRIC RANK
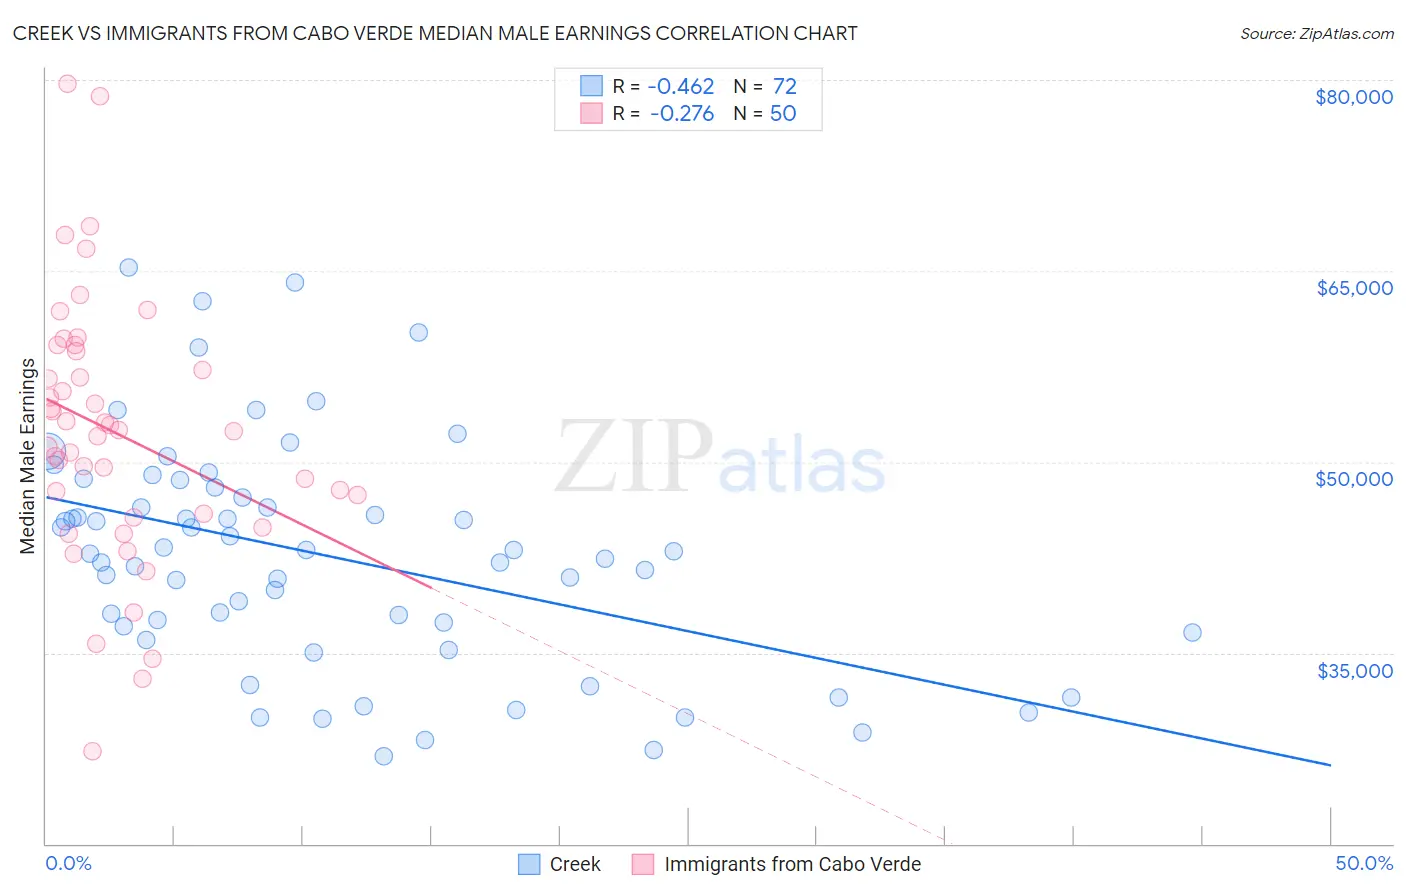
Creek vs Immigrants from Cabo Verde Median Male Earnings Correlation Chart
The statistical analysis conducted on geographies consisting of 178,430,593 people shows a moderate negative correlation between the proportion of Creek and median male earnings in the United States with a correlation coefficient (R) of -0.462 and weighted average of $46,594. Similarly, the statistical analysis conducted on geographies consisting of 38,152,357 people shows a weak negative correlation between the proportion of Immigrants from Cabo Verde and median male earnings in the United States with a correlation coefficient (R) of -0.276 and weighted average of $50,009, a difference of 7.3%.
Median Male Earnings Correlation Summary
| Measurement | Creek | Immigrants from Cabo Verde |
| Minimum | $26,855 | $27,292 |
| Maximum | $65,299 | $79,684 |
| Range | $38,444 | $52,392 |
| Mean | $42,595 | $52,373 |
| Median | $42,837 | $52,422 |
| Interquartile 25% (IQ1) | $36,835 | $45,929 |
| Interquartile 75% (IQ3) | $47,588 | $58,666 |
| Interquartile Range (IQR) | $10,753 | $12,737 |
| Standard Deviation (Sample) | $8,932 | $10,362 |
| Standard Deviation (Population) | $8,870 | $10,258 |
Similar Demographics by Median Male Earnings
Demographics Similar to Creek by Median Male Earnings
In terms of median male earnings, the demographic groups most similar to Creek are Cuban ($46,580, a difference of 0.030%), Ottawa ($46,611, a difference of 0.040%), Dutch West Indian ($46,656, a difference of 0.13%), Immigrants from Dominican Republic ($46,655, a difference of 0.13%), and Guatemalan ($46,736, a difference of 0.30%).
| Demographics | Rating | Rank | Median Male Earnings |
| Seminole | 0.1 /100 | #302 | Tragic $46,783 |
| Yaqui | 0.1 /100 | #303 | Tragic $46,777 |
| Bangladeshis | 0.1 /100 | #304 | Tragic $46,744 |
| Guatemalans | 0.0 /100 | #305 | Tragic $46,736 |
| Dutch West Indians | 0.0 /100 | #306 | Tragic $46,656 |
| Immigrants | Dominican Republic | 0.0 /100 | #307 | Tragic $46,655 |
| Ottawa | 0.0 /100 | #308 | Tragic $46,611 |
| Creek | 0.0 /100 | #309 | Tragic $46,594 |
| Cubans | 0.0 /100 | #310 | Tragic $46,580 |
| Apache | 0.0 /100 | #311 | Tragic $46,429 |
| Hispanics or Latinos | 0.0 /100 | #312 | Tragic $46,419 |
| Hondurans | 0.0 /100 | #313 | Tragic $46,374 |
| Chippewa | 0.0 /100 | #314 | Tragic $46,368 |
| Immigrants | Guatemala | 0.0 /100 | #315 | Tragic $46,244 |
| Immigrants | Caribbean | 0.0 /100 | #316 | Tragic $46,193 |
Demographics Similar to Immigrants from Cabo Verde by Median Male Earnings
In terms of median male earnings, the demographic groups most similar to Immigrants from Cabo Verde are German Russian ($49,924, a difference of 0.17%), Senegalese ($49,774, a difference of 0.47%), Alaskan Athabascan ($49,748, a difference of 0.52%), Immigrants from Grenada ($50,279, a difference of 0.54%), and Osage ($50,292, a difference of 0.57%).
| Demographics | Rating | Rank | Median Male Earnings |
| Hawaiians | 1.9 /100 | #245 | Tragic $50,488 |
| Immigrants | Ecuador | 1.9 /100 | #246 | Tragic $50,474 |
| Sub-Saharan Africans | 1.8 /100 | #247 | Tragic $50,408 |
| Immigrants | Guyana | 1.6 /100 | #248 | Tragic $50,321 |
| Immigrants | Burma/Myanmar | 1.6 /100 | #249 | Tragic $50,298 |
| Osage | 1.6 /100 | #250 | Tragic $50,292 |
| Immigrants | Grenada | 1.6 /100 | #251 | Tragic $50,279 |
| Immigrants | Cabo Verde | 1.2 /100 | #252 | Tragic $50,009 |
| German Russians | 1.1 /100 | #253 | Tragic $49,924 |
| Senegalese | 1.0 /100 | #254 | Tragic $49,774 |
| Alaskan Athabascans | 0.9 /100 | #255 | Tragic $49,748 |
| Alaska Natives | 0.9 /100 | #256 | Tragic $49,711 |
| British West Indians | 0.8 /100 | #257 | Tragic $49,636 |
| Cree | 0.7 /100 | #258 | Tragic $49,497 |
| Nepalese | 0.7 /100 | #259 | Tragic $49,458 |