Creek vs Immigrants from Chile Median Male Earnings
COMPARE
Creek
Immigrants from Chile
Median Male Earnings
Median Male Earnings Comparison
Creek
Immigrants from Chile
$46,594
MEDIAN MALE EARNINGS
0.0/ 100
METRIC RATING
309th/ 347
METRIC RANK
$55,954
MEDIAN MALE EARNINGS
80.7/ 100
METRIC RATING
146th/ 347
METRIC RANK
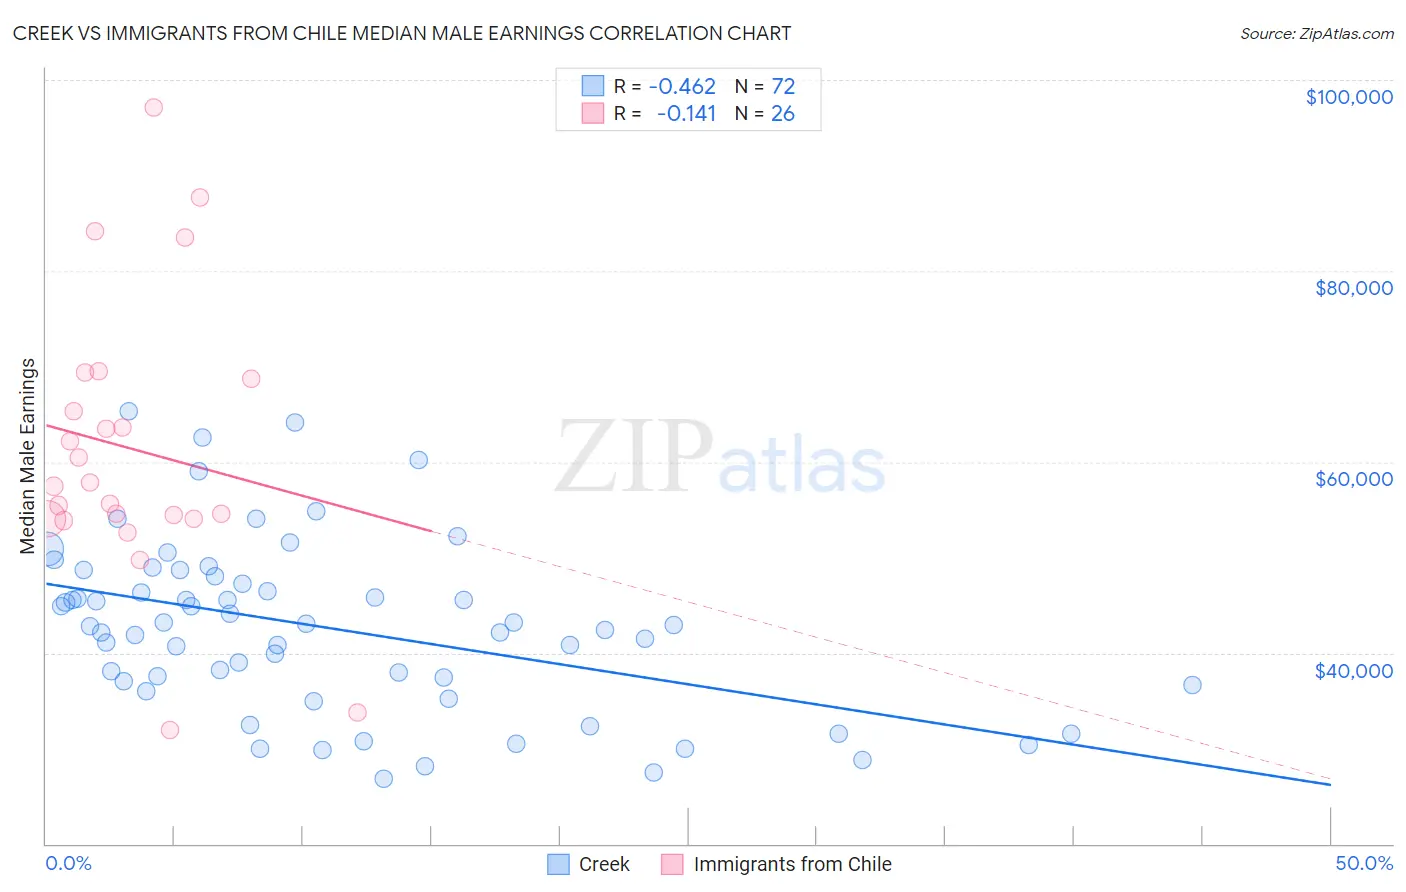
Creek vs Immigrants from Chile Median Male Earnings Correlation Chart
The statistical analysis conducted on geographies consisting of 178,430,593 people shows a moderate negative correlation between the proportion of Creek and median male earnings in the United States with a correlation coefficient (R) of -0.462 and weighted average of $46,594. Similarly, the statistical analysis conducted on geographies consisting of 218,627,915 people shows a poor negative correlation between the proportion of Immigrants from Chile and median male earnings in the United States with a correlation coefficient (R) of -0.141 and weighted average of $55,954, a difference of 20.1%.
Median Male Earnings Correlation Summary
| Measurement | Creek | Immigrants from Chile |
| Minimum | $26,855 | $31,923 |
| Maximum | $65,299 | $97,095 |
| Range | $38,444 | $65,172 |
| Mean | $42,595 | $61,352 |
| Median | $42,837 | $57,670 |
| Interquartile 25% (IQ1) | $36,835 | $54,075 |
| Interquartile 75% (IQ3) | $47,588 | $68,667 |
| Interquartile Range (IQR) | $10,753 | $14,592 |
| Standard Deviation (Sample) | $8,932 | $14,742 |
| Standard Deviation (Population) | $8,870 | $14,456 |
Similar Demographics by Median Male Earnings
Demographics Similar to Creek by Median Male Earnings
In terms of median male earnings, the demographic groups most similar to Creek are Cuban ($46,580, a difference of 0.030%), Ottawa ($46,611, a difference of 0.040%), Dutch West Indian ($46,656, a difference of 0.13%), Immigrants from Dominican Republic ($46,655, a difference of 0.13%), and Guatemalan ($46,736, a difference of 0.30%).
| Demographics | Rating | Rank | Median Male Earnings |
| Seminole | 0.1 /100 | #302 | Tragic $46,783 |
| Yaqui | 0.1 /100 | #303 | Tragic $46,777 |
| Bangladeshis | 0.1 /100 | #304 | Tragic $46,744 |
| Guatemalans | 0.0 /100 | #305 | Tragic $46,736 |
| Dutch West Indians | 0.0 /100 | #306 | Tragic $46,656 |
| Immigrants | Dominican Republic | 0.0 /100 | #307 | Tragic $46,655 |
| Ottawa | 0.0 /100 | #308 | Tragic $46,611 |
| Creek | 0.0 /100 | #309 | Tragic $46,594 |
| Cubans | 0.0 /100 | #310 | Tragic $46,580 |
| Apache | 0.0 /100 | #311 | Tragic $46,429 |
| Hispanics or Latinos | 0.0 /100 | #312 | Tragic $46,419 |
| Hondurans | 0.0 /100 | #313 | Tragic $46,374 |
| Chippewa | 0.0 /100 | #314 | Tragic $46,368 |
| Immigrants | Guatemala | 0.0 /100 | #315 | Tragic $46,244 |
| Immigrants | Caribbean | 0.0 /100 | #316 | Tragic $46,193 |
Demographics Similar to Immigrants from Chile by Median Male Earnings
In terms of median male earnings, the demographic groups most similar to Immigrants from Chile are Norwegian ($55,965, a difference of 0.020%), Immigrants from Uganda ($56,064, a difference of 0.20%), Immigrants from Philippines ($55,809, a difference of 0.26%), Scottish ($55,793, a difference of 0.29%), and Sri Lankan ($56,136, a difference of 0.33%).
| Demographics | Rating | Rank | Median Male Earnings |
| Zimbabweans | 85.5 /100 | #139 | Excellent $56,302 |
| Luxembourgers | 85.5 /100 | #140 | Excellent $56,300 |
| Danes | 84.8 /100 | #141 | Excellent $56,246 |
| Ethiopians | 84.8 /100 | #142 | Excellent $56,243 |
| Sri Lankans | 83.4 /100 | #143 | Excellent $56,136 |
| Immigrants | Uganda | 82.4 /100 | #144 | Excellent $56,064 |
| Norwegians | 80.9 /100 | #145 | Excellent $55,965 |
| Immigrants | Chile | 80.7 /100 | #146 | Excellent $55,954 |
| Immigrants | Philippines | 78.4 /100 | #147 | Good $55,809 |
| Scottish | 78.2 /100 | #148 | Good $55,793 |
| English | 77.4 /100 | #149 | Good $55,747 |
| Swiss | 77.1 /100 | #150 | Good $55,731 |
| Immigrants | Oceania | 76.8 /100 | #151 | Good $55,712 |
| Peruvians | 75.8 /100 | #152 | Good $55,659 |
| Immigrants | Nepal | 75.0 /100 | #153 | Good $55,615 |