Creek vs Immigrants from Germany Median Male Earnings
COMPARE
Creek
Immigrants from Germany
Median Male Earnings
Median Male Earnings Comparison
Creek
Immigrants from Germany
$46,594
MEDIAN MALE EARNINGS
0.0/ 100
METRIC RATING
309th/ 347
METRIC RANK
$56,542
MEDIAN MALE EARNINGS
88.2/ 100
METRIC RATING
133rd/ 347
METRIC RANK
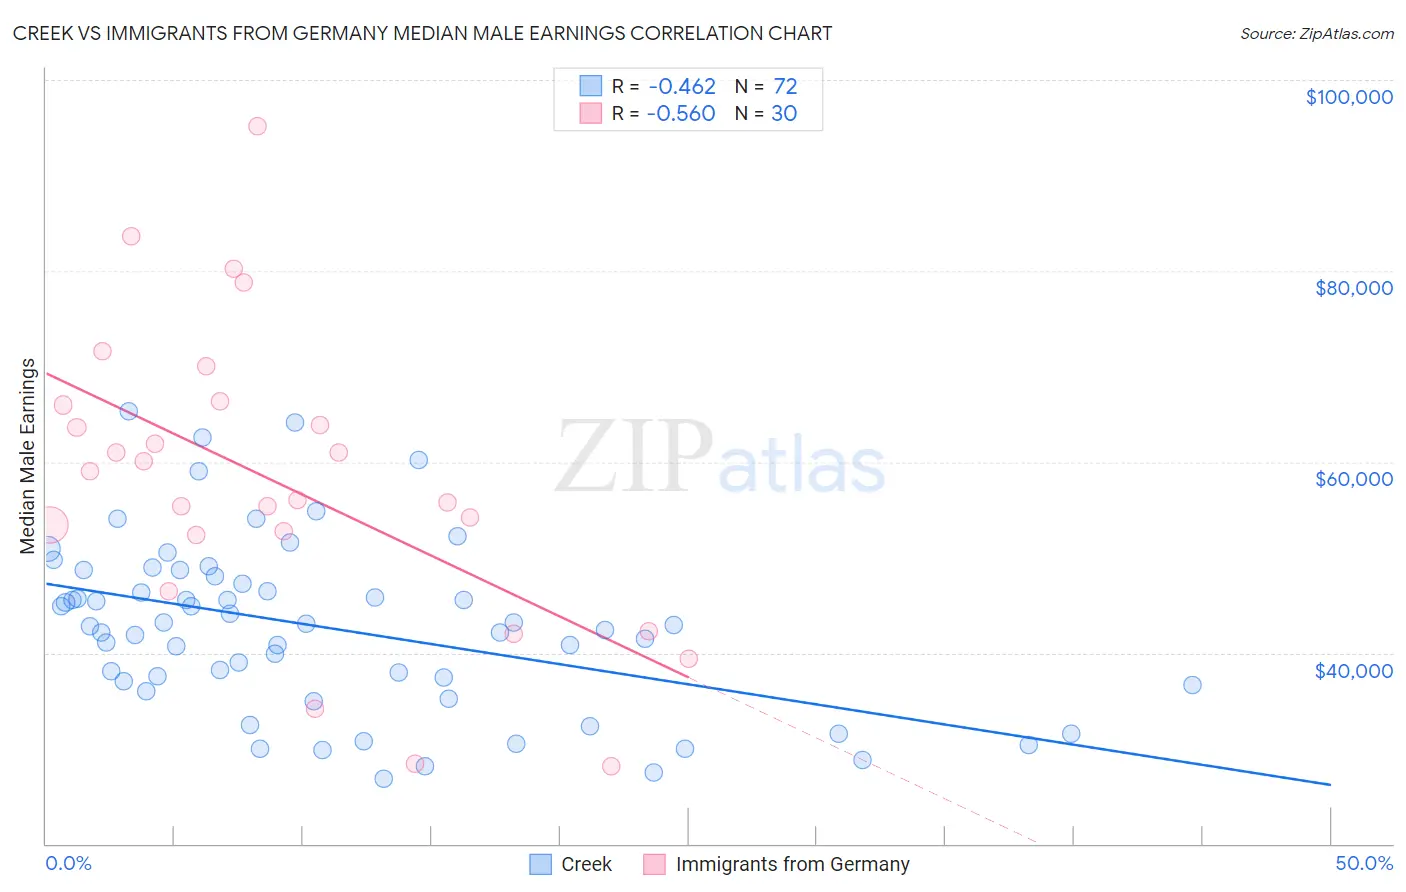
Creek vs Immigrants from Germany Median Male Earnings Correlation Chart
The statistical analysis conducted on geographies consisting of 178,430,593 people shows a moderate negative correlation between the proportion of Creek and median male earnings in the United States with a correlation coefficient (R) of -0.462 and weighted average of $46,594. Similarly, the statistical analysis conducted on geographies consisting of 463,604,477 people shows a substantial negative correlation between the proportion of Immigrants from Germany and median male earnings in the United States with a correlation coefficient (R) of -0.560 and weighted average of $56,542, a difference of 21.3%.
Median Male Earnings Correlation Summary
| Measurement | Creek | Immigrants from Germany |
| Minimum | $26,855 | $28,125 |
| Maximum | $65,299 | $95,140 |
| Range | $38,444 | $67,015 |
| Mean | $42,595 | $57,924 |
| Median | $42,837 | $57,493 |
| Interquartile 25% (IQ1) | $36,835 | $52,399 |
| Interquartile 75% (IQ3) | $47,588 | $65,976 |
| Interquartile Range (IQR) | $10,753 | $13,576 |
| Standard Deviation (Sample) | $8,932 | $15,513 |
| Standard Deviation (Population) | $8,870 | $15,253 |
Similar Demographics by Median Male Earnings
Demographics Similar to Creek by Median Male Earnings
In terms of median male earnings, the demographic groups most similar to Creek are Cuban ($46,580, a difference of 0.030%), Ottawa ($46,611, a difference of 0.040%), Dutch West Indian ($46,656, a difference of 0.13%), Immigrants from Dominican Republic ($46,655, a difference of 0.13%), and Guatemalan ($46,736, a difference of 0.30%).
| Demographics | Rating | Rank | Median Male Earnings |
| Seminole | 0.1 /100 | #302 | Tragic $46,783 |
| Yaqui | 0.1 /100 | #303 | Tragic $46,777 |
| Bangladeshis | 0.1 /100 | #304 | Tragic $46,744 |
| Guatemalans | 0.0 /100 | #305 | Tragic $46,736 |
| Dutch West Indians | 0.0 /100 | #306 | Tragic $46,656 |
| Immigrants | Dominican Republic | 0.0 /100 | #307 | Tragic $46,655 |
| Ottawa | 0.0 /100 | #308 | Tragic $46,611 |
| Creek | 0.0 /100 | #309 | Tragic $46,594 |
| Cubans | 0.0 /100 | #310 | Tragic $46,580 |
| Apache | 0.0 /100 | #311 | Tragic $46,429 |
| Hispanics or Latinos | 0.0 /100 | #312 | Tragic $46,419 |
| Hondurans | 0.0 /100 | #313 | Tragic $46,374 |
| Chippewa | 0.0 /100 | #314 | Tragic $46,368 |
| Immigrants | Guatemala | 0.0 /100 | #315 | Tragic $46,244 |
| Immigrants | Caribbean | 0.0 /100 | #316 | Tragic $46,193 |
Demographics Similar to Immigrants from Germany by Median Male Earnings
In terms of median male earnings, the demographic groups most similar to Immigrants from Germany are Czech ($56,546, a difference of 0.010%), Moroccan ($56,499, a difference of 0.080%), Irish ($56,464, a difference of 0.14%), Immigrants from Saudi Arabia ($56,452, a difference of 0.16%), and Portuguese ($56,663, a difference of 0.21%).
| Demographics | Rating | Rank | Median Male Earnings |
| Chinese | 91.1 /100 | #126 | Exceptional $56,872 |
| Brazilians | 90.9 /100 | #127 | Exceptional $56,837 |
| Immigrants | Syria | 90.8 /100 | #128 | Exceptional $56,830 |
| Pakistanis | 89.9 /100 | #129 | Excellent $56,719 |
| Koreans | 89.4 /100 | #130 | Excellent $56,672 |
| Portuguese | 89.4 /100 | #131 | Excellent $56,663 |
| Czechs | 88.2 /100 | #132 | Excellent $56,546 |
| Immigrants | Germany | 88.2 /100 | #133 | Excellent $56,542 |
| Moroccans | 87.7 /100 | #134 | Excellent $56,499 |
| Irish | 87.4 /100 | #135 | Excellent $56,464 |
| Immigrants | Saudi Arabia | 87.2 /100 | #136 | Excellent $56,452 |
| Slavs | 86.5 /100 | #137 | Excellent $56,390 |
| Slovaks | 85.5 /100 | #138 | Excellent $56,306 |
| Zimbabweans | 85.5 /100 | #139 | Excellent $56,302 |
| Luxembourgers | 85.5 /100 | #140 | Excellent $56,300 |