Immigrants from Dominican Republic vs Immigrants from El Salvador Median Male Earnings
COMPARE
Immigrants from Dominican Republic
Immigrants from El Salvador
Median Male Earnings
Median Male Earnings Comparison
Immigrants from Dominican Republic
Immigrants from El Salvador
$46,655
MEDIAN MALE EARNINGS
0.0/ 100
METRIC RATING
307th/ 347
METRIC RANK
$47,973
MEDIAN MALE EARNINGS
0.2/ 100
METRIC RATING
287th/ 347
METRIC RANK
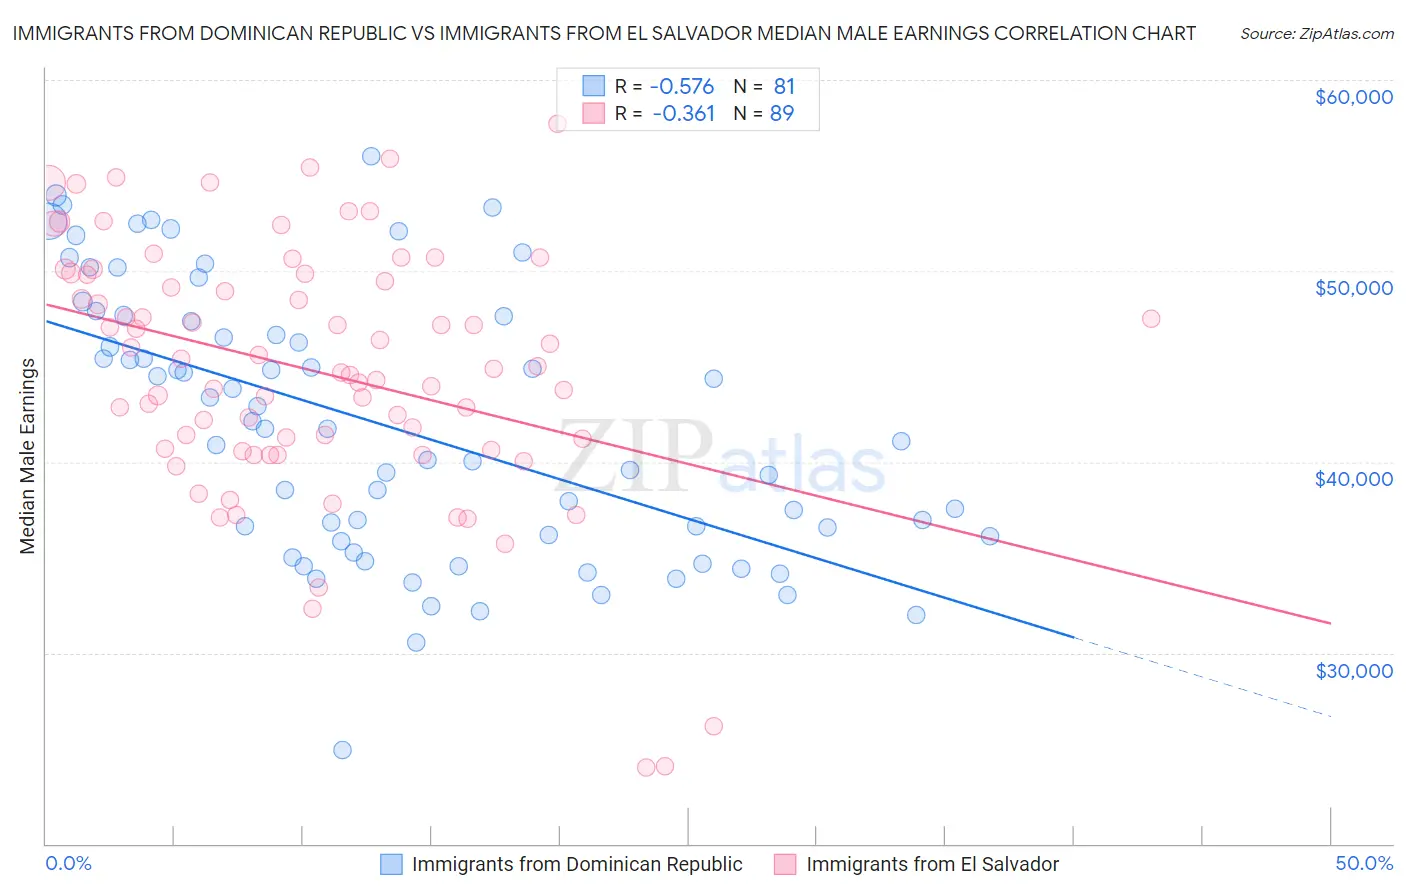
Immigrants from Dominican Republic vs Immigrants from El Salvador Median Male Earnings Correlation Chart
The statistical analysis conducted on geographies consisting of 274,998,271 people shows a substantial negative correlation between the proportion of Immigrants from Dominican Republic and median male earnings in the United States with a correlation coefficient (R) of -0.576 and weighted average of $46,655. Similarly, the statistical analysis conducted on geographies consisting of 357,755,814 people shows a mild negative correlation between the proportion of Immigrants from El Salvador and median male earnings in the United States with a correlation coefficient (R) of -0.361 and weighted average of $47,973, a difference of 2.8%.
Median Male Earnings Correlation Summary
| Measurement | Immigrants from Dominican Republic | Immigrants from El Salvador |
| Minimum | $24,931 | $24,025 |
| Maximum | $56,014 | $57,715 |
| Range | $31,083 | $33,690 |
| Mean | $41,875 | $44,787 |
| Median | $41,710 | $44,909 |
| Interquartile 25% (IQ1) | $35,983 | $40,644 |
| Interquartile 75% (IQ3) | $47,499 | $49,826 |
| Interquartile Range (IQR) | $11,516 | $9,182 |
| Standard Deviation (Sample) | $7,016 | $6,677 |
| Standard Deviation (Population) | $6,972 | $6,639 |
Demographics Similar to Immigrants from Dominican Republic and Immigrants from El Salvador by Median Male Earnings
In terms of median male earnings, the demographic groups most similar to Immigrants from Dominican Republic are Dutch West Indian ($46,656, a difference of 0.0%), Guatemalan ($46,736, a difference of 0.17%), Bangladeshi ($46,744, a difference of 0.19%), Yaqui ($46,777, a difference of 0.26%), and Seminole ($46,783, a difference of 0.27%). Similarly, the demographic groups most similar to Immigrants from El Salvador are Shoshone ($47,930, a difference of 0.090%), Chickasaw ($47,832, a difference of 0.30%), Immigrants from Belize ($47,809, a difference of 0.34%), Choctaw ($47,729, a difference of 0.51%), and Immigrants from Dominica ($47,651, a difference of 0.68%).
| Demographics | Rating | Rank | Median Male Earnings |
| Immigrants | El Salvador | 0.2 /100 | #287 | Tragic $47,973 |
| Shoshone | 0.2 /100 | #288 | Tragic $47,930 |
| Chickasaw | 0.1 /100 | #289 | Tragic $47,832 |
| Immigrants | Belize | 0.1 /100 | #290 | Tragic $47,809 |
| Choctaw | 0.1 /100 | #291 | Tragic $47,729 |
| Immigrants | Dominica | 0.1 /100 | #292 | Tragic $47,651 |
| Indonesians | 0.1 /100 | #293 | Tragic $47,503 |
| Immigrants | Nicaragua | 0.1 /100 | #294 | Tragic $47,482 |
| Central American Indians | 0.1 /100 | #295 | Tragic $47,433 |
| Inupiat | 0.1 /100 | #296 | Tragic $47,281 |
| Dominicans | 0.1 /100 | #297 | Tragic $47,204 |
| Immigrants | Micronesia | 0.1 /100 | #298 | Tragic $47,177 |
| Immigrants | Zaire | 0.1 /100 | #299 | Tragic $47,070 |
| U.S. Virgin Islanders | 0.1 /100 | #300 | Tragic $47,066 |
| Immigrants | Latin America | 0.1 /100 | #301 | Tragic $46,941 |
| Seminole | 0.1 /100 | #302 | Tragic $46,783 |
| Yaqui | 0.1 /100 | #303 | Tragic $46,777 |
| Bangladeshis | 0.1 /100 | #304 | Tragic $46,744 |
| Guatemalans | 0.0 /100 | #305 | Tragic $46,736 |
| Dutch West Indians | 0.0 /100 | #306 | Tragic $46,656 |
| Immigrants | Dominican Republic | 0.0 /100 | #307 | Tragic $46,655 |