Croatian vs Immigrants from El Salvador Median Male Earnings
COMPARE
Croatian
Immigrants from El Salvador
Median Male Earnings
Median Male Earnings Comparison
Croatians
Immigrants from El Salvador
$59,715
MEDIAN MALE EARNINGS
99.4/ 100
METRIC RATING
82nd/ 347
METRIC RANK
$47,973
MEDIAN MALE EARNINGS
0.2/ 100
METRIC RATING
287th/ 347
METRIC RANK
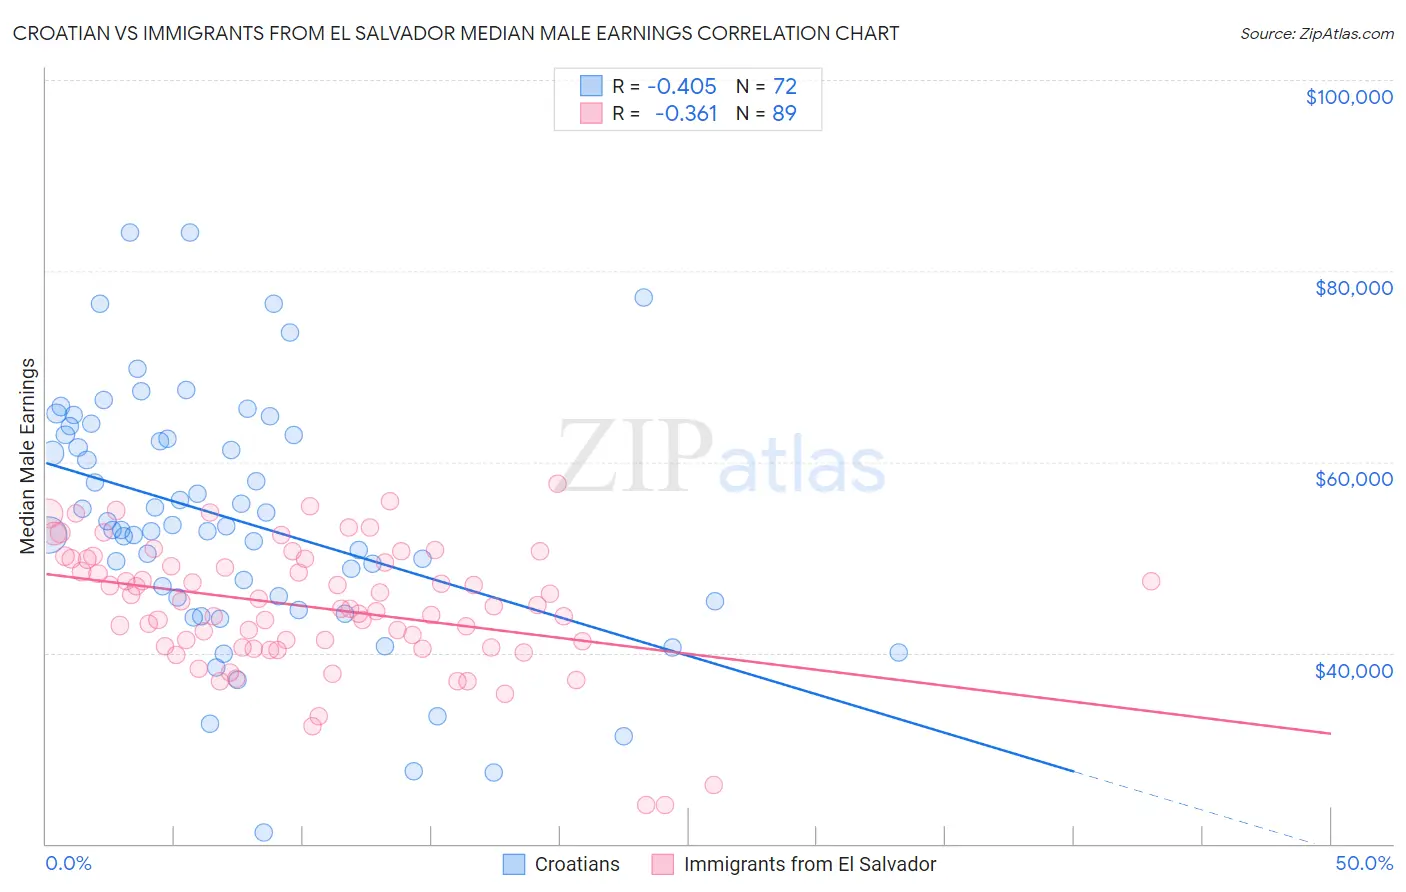
Croatian vs Immigrants from El Salvador Median Male Earnings Correlation Chart
The statistical analysis conducted on geographies consisting of 375,622,931 people shows a moderate negative correlation between the proportion of Croatians and median male earnings in the United States with a correlation coefficient (R) of -0.405 and weighted average of $59,715. Similarly, the statistical analysis conducted on geographies consisting of 357,755,814 people shows a mild negative correlation between the proportion of Immigrants from El Salvador and median male earnings in the United States with a correlation coefficient (R) of -0.361 and weighted average of $47,973, a difference of 24.5%.
Median Male Earnings Correlation Summary
| Measurement | Croatian | Immigrants from El Salvador |
| Minimum | $21,121 | $24,025 |
| Maximum | $84,044 | $57,715 |
| Range | $62,923 | $33,690 |
| Mean | $53,900 | $44,787 |
| Median | $53,037 | $44,909 |
| Interquartile 25% (IQ1) | $45,591 | $40,644 |
| Interquartile 75% (IQ3) | $62,805 | $49,826 |
| Interquartile Range (IQR) | $17,214 | $9,182 |
| Standard Deviation (Sample) | $12,980 | $6,677 |
| Standard Deviation (Population) | $12,890 | $6,639 |
Similar Demographics by Median Male Earnings
Demographics Similar to Croatians by Median Male Earnings
In terms of median male earnings, the demographic groups most similar to Croatians are Ukrainian ($59,728, a difference of 0.020%), Immigrants from Italy ($59,691, a difference of 0.040%), Immigrants from Hungary ($59,806, a difference of 0.15%), Immigrants from Ukraine ($59,820, a difference of 0.18%), and Afghan ($59,554, a difference of 0.27%).
| Demographics | Rating | Rank | Median Male Earnings |
| Immigrants | Bolivia | 99.6 /100 | #75 | Exceptional $60,088 |
| Romanians | 99.6 /100 | #76 | Exceptional $60,063 |
| Paraguayans | 99.5 /100 | #77 | Exceptional $59,975 |
| Immigrants | Egypt | 99.5 /100 | #78 | Exceptional $59,925 |
| Immigrants | Ukraine | 99.5 /100 | #79 | Exceptional $59,820 |
| Immigrants | Hungary | 99.5 /100 | #80 | Exceptional $59,806 |
| Ukrainians | 99.4 /100 | #81 | Exceptional $59,728 |
| Croatians | 99.4 /100 | #82 | Exceptional $59,715 |
| Immigrants | Italy | 99.4 /100 | #83 | Exceptional $59,691 |
| Afghans | 99.3 /100 | #84 | Exceptional $59,554 |
| Italians | 99.3 /100 | #85 | Exceptional $59,551 |
| Immigrants | England | 99.3 /100 | #86 | Exceptional $59,527 |
| Macedonians | 99.3 /100 | #87 | Exceptional $59,522 |
| Immigrants | Argentina | 99.3 /100 | #88 | Exceptional $59,491 |
| Immigrants | Moldova | 99.2 /100 | #89 | Exceptional $59,417 |
Demographics Similar to Immigrants from El Salvador by Median Male Earnings
In terms of median male earnings, the demographic groups most similar to Immigrants from El Salvador are African ($47,994, a difference of 0.040%), Paiute ($47,991, a difference of 0.040%), Mexican American Indian ($47,990, a difference of 0.040%), Shoshone ($47,930, a difference of 0.090%), and Immigrants from Jamaica ($48,040, a difference of 0.14%).
| Demographics | Rating | Rank | Median Male Earnings |
| Comanche | 0.2 /100 | #280 | Tragic $48,202 |
| Marshallese | 0.2 /100 | #281 | Tragic $48,137 |
| Central Americans | 0.2 /100 | #282 | Tragic $48,093 |
| Immigrants | Jamaica | 0.2 /100 | #283 | Tragic $48,040 |
| Africans | 0.2 /100 | #284 | Tragic $47,994 |
| Paiute | 0.2 /100 | #285 | Tragic $47,991 |
| Mexican American Indians | 0.2 /100 | #286 | Tragic $47,990 |
| Immigrants | El Salvador | 0.2 /100 | #287 | Tragic $47,973 |
| Shoshone | 0.2 /100 | #288 | Tragic $47,930 |
| Chickasaw | 0.1 /100 | #289 | Tragic $47,832 |
| Immigrants | Belize | 0.1 /100 | #290 | Tragic $47,809 |
| Choctaw | 0.1 /100 | #291 | Tragic $47,729 |
| Immigrants | Dominica | 0.1 /100 | #292 | Tragic $47,651 |
| Indonesians | 0.1 /100 | #293 | Tragic $47,503 |
| Immigrants | Nicaragua | 0.1 /100 | #294 | Tragic $47,482 |