Celtic vs Immigrants from Austria Wage/Income Gap
COMPARE
Celtic
Immigrants from Austria
Wage/Income Gap
Wage/Income Gap Comparison
Celtics
Immigrants from Austria
27.3%
WAGE/INCOME GAP
2.8/ 100
METRIC RATING
247th/ 347
METRIC RANK
28.1%
WAGE/INCOME GAP
0.4/ 100
METRIC RATING
286th/ 347
METRIC RANK
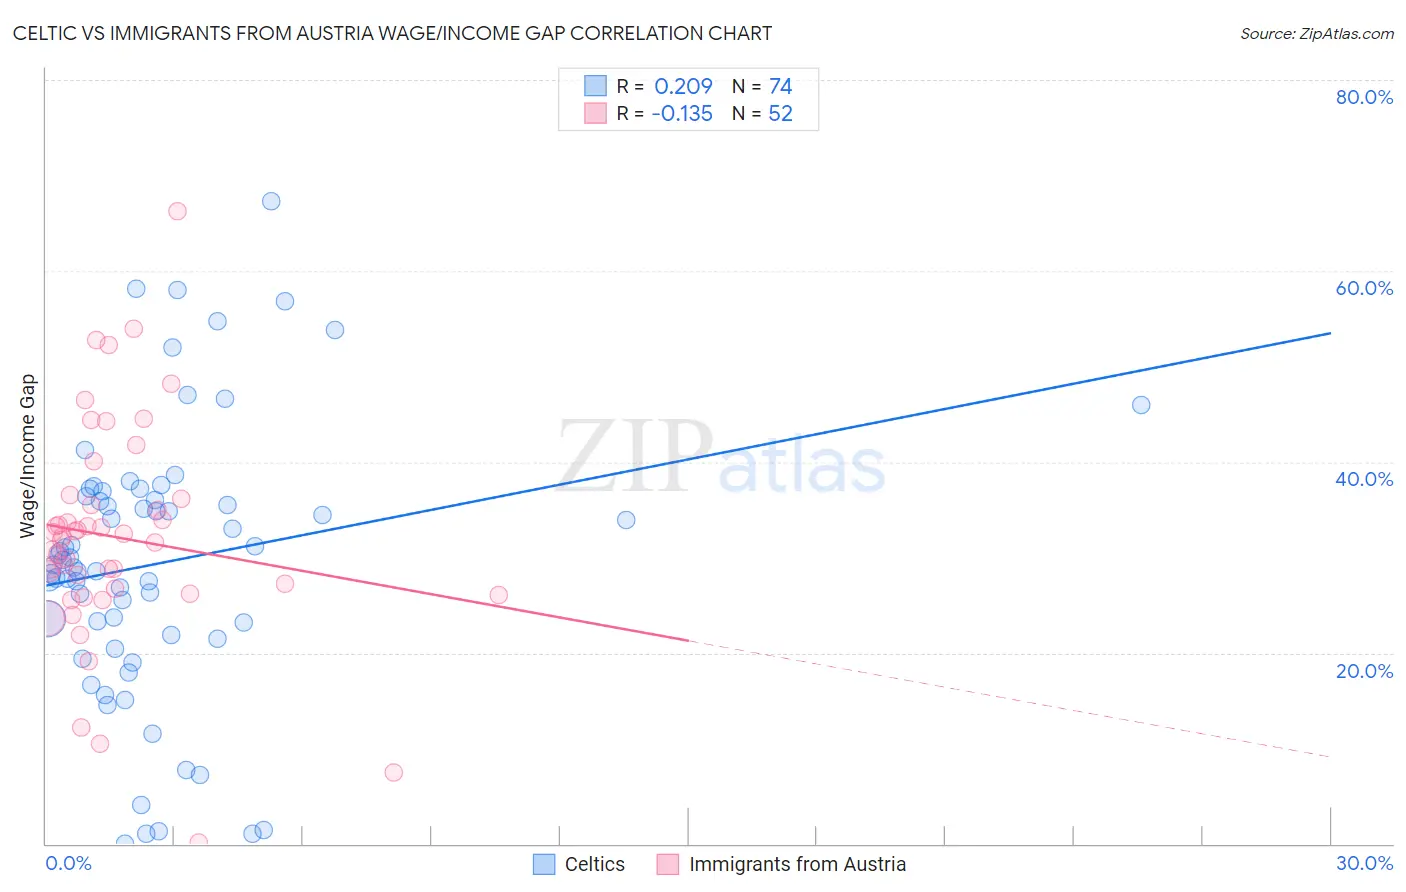
Celtic vs Immigrants from Austria Wage/Income Gap Correlation Chart
The statistical analysis conducted on geographies consisting of 168,805,315 people shows a weak positive correlation between the proportion of Celtics and wage/income gap percentage in the United States with a correlation coefficient (R) of 0.209 and weighted average of 27.3%. Similarly, the statistical analysis conducted on geographies consisting of 167,902,173 people shows a poor negative correlation between the proportion of Immigrants from Austria and wage/income gap percentage in the United States with a correlation coefficient (R) of -0.135 and weighted average of 28.1%, a difference of 3.1%.
Wage/Income Gap Correlation Summary
| Measurement | Celtic | Immigrants from Austria |
| Minimum | 0.040% | 0.18% |
| Maximum | 67.3% | 66.3% |
| Range | 67.3% | 66.1% |
| Mean | 29.4% | 32.1% |
| Median | 29.5% | 32.1% |
| Interquartile 25% (IQ1) | 21.9% | 26.4% |
| Interquartile 75% (IQ3) | 36.4% | 35.9% |
| Interquartile Range (IQR) | 14.5% | 9.4% |
| Standard Deviation (Sample) | 14.3% | 11.6% |
| Standard Deviation (Population) | 14.2% | 11.5% |
Similar Demographics by Wage/Income Gap
Demographics Similar to Celtics by Wage/Income Gap
In terms of wage/income gap, the demographic groups most similar to Celtics are Cypriot (27.3%, a difference of 0.010%), Carpatho Rusyn (27.3%, a difference of 0.020%), Immigrants from Czechoslovakia (27.3%, a difference of 0.030%), Immigrants from Norway (27.3%, a difference of 0.14%), and Ukrainian (27.3%, a difference of 0.20%).
| Demographics | Rating | Rank | Wage/Income Gap |
| Immigrants | Europe | 3.8 /100 | #240 | Tragic 27.1% |
| Creek | 3.8 /100 | #241 | Tragic 27.1% |
| Immigrants | Sri Lanka | 3.7 /100 | #242 | Tragic 27.1% |
| Spanish | 3.6 /100 | #243 | Tragic 27.1% |
| Chickasaw | 3.5 /100 | #244 | Tragic 27.2% |
| Immigrants | Azores | 3.5 /100 | #245 | Tragic 27.2% |
| Immigrants | Nonimmigrants | 3.3 /100 | #246 | Tragic 27.2% |
| Celtics | 2.8 /100 | #247 | Tragic 27.3% |
| Cypriots | 2.8 /100 | #248 | Tragic 27.3% |
| Carpatho Rusyns | 2.7 /100 | #249 | Tragic 27.3% |
| Immigrants | Czechoslovakia | 2.7 /100 | #250 | Tragic 27.3% |
| Immigrants | Norway | 2.5 /100 | #251 | Tragic 27.3% |
| Ukrainians | 2.4 /100 | #252 | Tragic 27.3% |
| Portuguese | 2.2 /100 | #253 | Tragic 27.4% |
| Israelis | 2.1 /100 | #254 | Tragic 27.4% |
Demographics Similar to Immigrants from Austria by Wage/Income Gap
In terms of wage/income gap, the demographic groups most similar to Immigrants from Austria are Italian (28.1%, a difference of 0.030%), Okinawan (28.1%, a difference of 0.040%), Choctaw (28.1%, a difference of 0.070%), Canadian (28.1%, a difference of 0.11%), and Immigrants from Sweden (28.1%, a difference of 0.16%).
| Demographics | Rating | Rank | Wage/Income Gap |
| Romanians | 0.5 /100 | #279 | Tragic 28.0% |
| Russians | 0.5 /100 | #280 | Tragic 28.0% |
| Burmese | 0.5 /100 | #281 | Tragic 28.0% |
| South Africans | 0.5 /100 | #282 | Tragic 28.0% |
| French Canadians | 0.4 /100 | #283 | Tragic 28.1% |
| Immigrants | Sweden | 0.4 /100 | #284 | Tragic 28.1% |
| Italians | 0.4 /100 | #285 | Tragic 28.1% |
| Immigrants | Austria | 0.4 /100 | #286 | Tragic 28.1% |
| Okinawans | 0.4 /100 | #287 | Tragic 28.1% |
| Choctaw | 0.4 /100 | #288 | Tragic 28.1% |
| Canadians | 0.3 /100 | #289 | Tragic 28.1% |
| Australians | 0.3 /100 | #290 | Tragic 28.2% |
| Czechoslovakians | 0.3 /100 | #291 | Tragic 28.2% |
| Immigrants | Australia | 0.3 /100 | #292 | Tragic 28.2% |
| Immigrants | Israel | 0.3 /100 | #293 | Tragic 28.2% |