Celtic vs Immigrants from Austria Nursery School
COMPARE
Celtic
Immigrants from Austria
Nursery School
Nursery School Comparison
Celtics
Immigrants from Austria
98.5%
NURSERY SCHOOL
99.8/ 100
METRIC RATING
50th/ 347
METRIC RANK
98.4%
NURSERY SCHOOL
99.6/ 100
METRIC RATING
69th/ 347
METRIC RANK
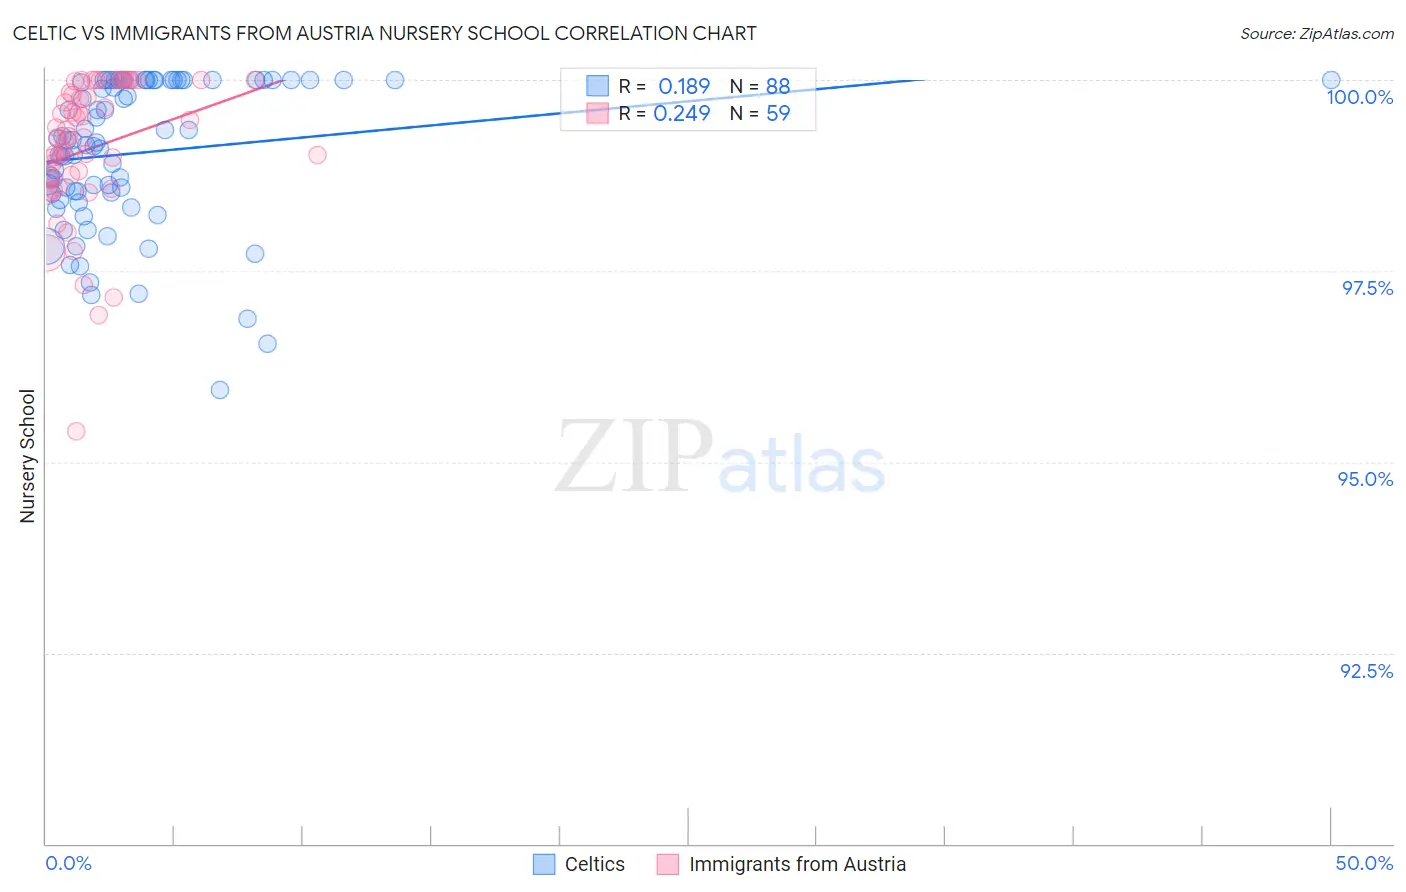
Celtic vs Immigrants from Austria Nursery School Correlation Chart
The statistical analysis conducted on geographies consisting of 168,875,705 people shows a poor positive correlation between the proportion of Celtics and percentage of population with at least nursery school education in the United States with a correlation coefficient (R) of 0.189 and weighted average of 98.5%. Similarly, the statistical analysis conducted on geographies consisting of 167,973,800 people shows a weak positive correlation between the proportion of Immigrants from Austria and percentage of population with at least nursery school education in the United States with a correlation coefficient (R) of 0.249 and weighted average of 98.4%, a difference of 0.060%.
Nursery School Correlation Summary
| Measurement | Celtic | Immigrants from Austria |
| Minimum | 95.9% | 95.4% |
| Maximum | 100.0% | 100.0% |
| Range | 4.1% | 4.6% |
| Mean | 99.0% | 99.1% |
| Median | 99.2% | 99.2% |
| Interquartile 25% (IQ1) | 98.5% | 98.7% |
| Interquartile 75% (IQ3) | 100.0% | 99.8% |
| Interquartile Range (IQR) | 1.5% | 1.1% |
| Standard Deviation (Sample) | 0.96% | 0.92% |
| Standard Deviation (Population) | 0.95% | 0.91% |
Demographics Similar to Celtics and Immigrants from Austria by Nursery School
In terms of nursery school, the demographic groups most similar to Celtics are White/Caucasian (98.5%, a difference of 0.0%), Estonian (98.5%, a difference of 0.0%), Australian (98.5%, a difference of 0.0%), Kiowa (98.4%, a difference of 0.010%), and Pueblo (98.4%, a difference of 0.010%). Similarly, the demographic groups most similar to Immigrants from Austria are Immigrants from Northern Europe (98.4%, a difference of 0.0%), Russian (98.4%, a difference of 0.0%), Canadian (98.4%, a difference of 0.010%), Immigrants from North America (98.4%, a difference of 0.020%), and Greek (98.4%, a difference of 0.020%).
| Demographics | Rating | Rank | Nursery School |
| Whites/Caucasians | 99.8 /100 | #49 | Exceptional 98.5% |
| Celtics | 99.8 /100 | #50 | Exceptional 98.5% |
| Estonians | 99.8 /100 | #51 | Exceptional 98.5% |
| Australians | 99.8 /100 | #52 | Exceptional 98.5% |
| Kiowa | 99.8 /100 | #53 | Exceptional 98.4% |
| Pueblo | 99.8 /100 | #54 | Exceptional 98.4% |
| Immigrants | Scotland | 99.8 /100 | #55 | Exceptional 98.4% |
| Americans | 99.8 /100 | #56 | Exceptional 98.4% |
| Austrians | 99.8 /100 | #57 | Exceptional 98.4% |
| Bulgarians | 99.8 /100 | #58 | Exceptional 98.4% |
| Immigrants | Canada | 99.8 /100 | #59 | Exceptional 98.4% |
| Slavs | 99.8 /100 | #60 | Exceptional 98.4% |
| New Zealanders | 99.7 /100 | #61 | Exceptional 98.4% |
| Creek | 99.7 /100 | #62 | Exceptional 98.4% |
| Immigrants | North America | 99.7 /100 | #63 | Exceptional 98.4% |
| Greeks | 99.7 /100 | #64 | Exceptional 98.4% |
| Maltese | 99.7 /100 | #65 | Exceptional 98.4% |
| Canadians | 99.7 /100 | #66 | Exceptional 98.4% |
| Immigrants | Northern Europe | 99.6 /100 | #67 | Exceptional 98.4% |
| Russians | 99.6 /100 | #68 | Exceptional 98.4% |
| Immigrants | Austria | 99.6 /100 | #69 | Exceptional 98.4% |