Jordanian vs Immigrants from Austria Wage/Income Gap
COMPARE
Jordanian
Immigrants from Austria
Wage/Income Gap
Wage/Income Gap Comparison
Jordanians
Immigrants from Austria
26.8%
WAGE/INCOME GAP
8.0/ 100
METRIC RATING
223rd/ 347
METRIC RANK
28.1%
WAGE/INCOME GAP
0.4/ 100
METRIC RATING
286th/ 347
METRIC RANK
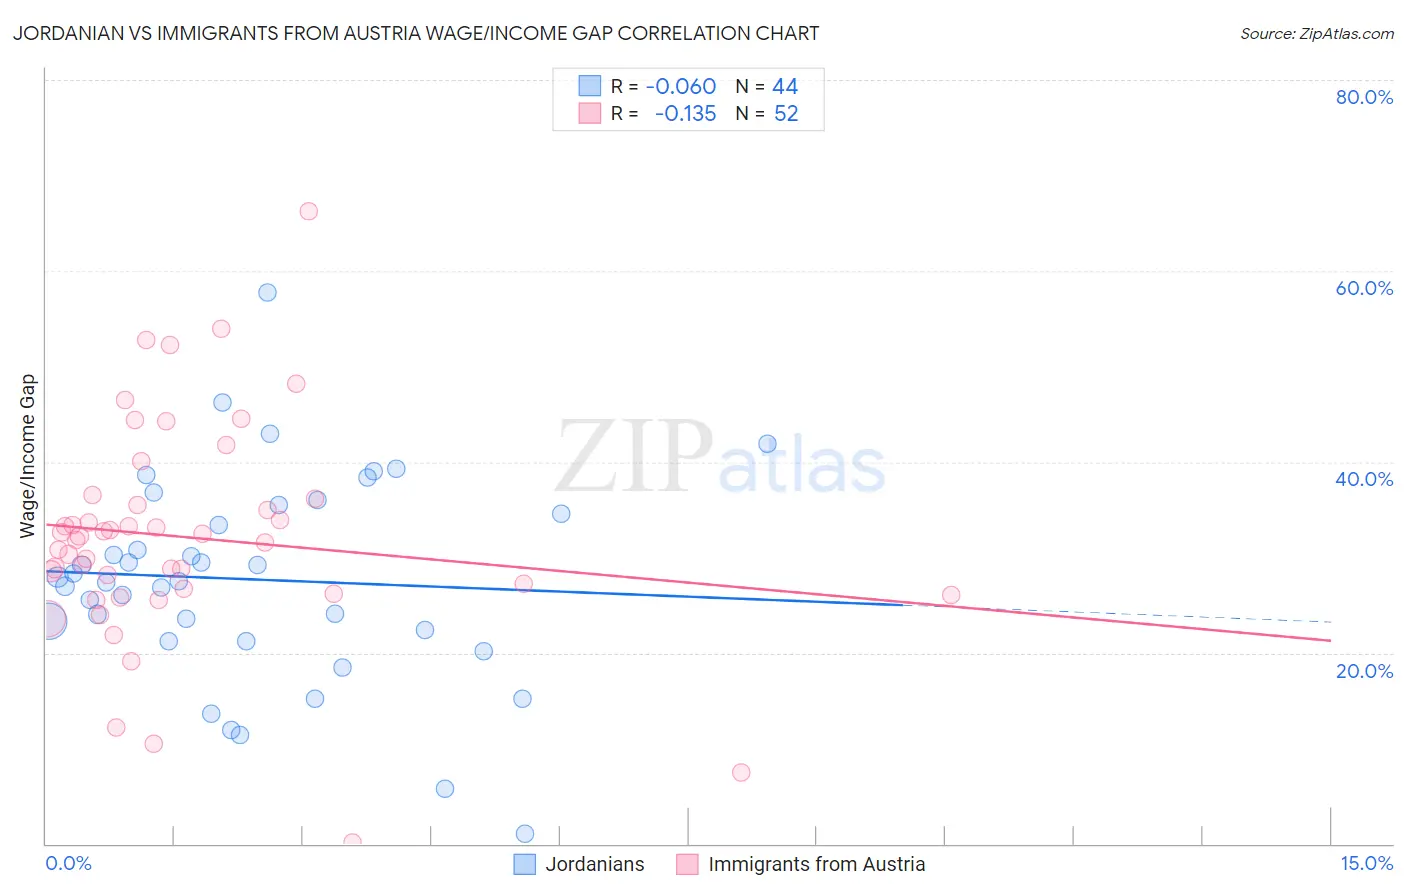
Jordanian vs Immigrants from Austria Wage/Income Gap Correlation Chart
The statistical analysis conducted on geographies consisting of 166,410,383 people shows a slight negative correlation between the proportion of Jordanians and wage/income gap percentage in the United States with a correlation coefficient (R) of -0.060 and weighted average of 26.8%. Similarly, the statistical analysis conducted on geographies consisting of 167,902,173 people shows a poor negative correlation between the proportion of Immigrants from Austria and wage/income gap percentage in the United States with a correlation coefficient (R) of -0.135 and weighted average of 28.1%, a difference of 4.9%.
Wage/Income Gap Correlation Summary
| Measurement | Jordanian | Immigrants from Austria |
| Minimum | 1.1% | 0.18% |
| Maximum | 57.8% | 66.3% |
| Range | 56.7% | 66.1% |
| Mean | 27.7% | 32.1% |
| Median | 27.7% | 32.1% |
| Interquartile 25% (IQ1) | 21.8% | 26.4% |
| Interquartile 75% (IQ3) | 35.0% | 35.9% |
| Interquartile Range (IQR) | 13.2% | 9.4% |
| Standard Deviation (Sample) | 10.8% | 11.6% |
| Standard Deviation (Population) | 10.7% | 11.5% |
Similar Demographics by Wage/Income Gap
Demographics Similar to Jordanians by Wage/Income Gap
In terms of wage/income gap, the demographic groups most similar to Jordanians are Bolivian (26.8%, a difference of 0.070%), Immigrants from Spain (26.8%, a difference of 0.11%), Immigrants from Argentina (26.8%, a difference of 0.17%), Immigrants from Latvia (26.7%, a difference of 0.18%), and Immigrants from Poland (26.7%, a difference of 0.19%).
| Demographics | Rating | Rank | Wage/Income Gap |
| Immigrants | Portugal | 9.5 /100 | #216 | Tragic 26.7% |
| Brazilians | 9.2 /100 | #217 | Tragic 26.7% |
| Immigrants | Saudi Arabia | 9.1 /100 | #218 | Tragic 26.7% |
| Immigrants | Poland | 8.9 /100 | #219 | Tragic 26.7% |
| Immigrants | Latvia | 8.9 /100 | #220 | Tragic 26.7% |
| Immigrants | Spain | 8.5 /100 | #221 | Tragic 26.8% |
| Bolivians | 8.3 /100 | #222 | Tragic 26.8% |
| Jordanians | 8.0 /100 | #223 | Tragic 26.8% |
| Immigrants | Argentina | 7.2 /100 | #224 | Tragic 26.8% |
| Immigrants | Ireland | 6.5 /100 | #225 | Tragic 26.9% |
| Asians | 5.9 /100 | #226 | Tragic 26.9% |
| Spaniards | 5.6 /100 | #227 | Tragic 27.0% |
| Immigrants | Turkey | 5.6 /100 | #228 | Tragic 27.0% |
| Immigrants | Asia | 5.5 /100 | #229 | Tragic 27.0% |
| Ottawa | 5.3 /100 | #230 | Tragic 27.0% |
Demographics Similar to Immigrants from Austria by Wage/Income Gap
In terms of wage/income gap, the demographic groups most similar to Immigrants from Austria are Italian (28.1%, a difference of 0.030%), Okinawan (28.1%, a difference of 0.040%), Choctaw (28.1%, a difference of 0.070%), Canadian (28.1%, a difference of 0.11%), and Immigrants from Sweden (28.1%, a difference of 0.16%).
| Demographics | Rating | Rank | Wage/Income Gap |
| Romanians | 0.5 /100 | #279 | Tragic 28.0% |
| Russians | 0.5 /100 | #280 | Tragic 28.0% |
| Burmese | 0.5 /100 | #281 | Tragic 28.0% |
| South Africans | 0.5 /100 | #282 | Tragic 28.0% |
| French Canadians | 0.4 /100 | #283 | Tragic 28.1% |
| Immigrants | Sweden | 0.4 /100 | #284 | Tragic 28.1% |
| Italians | 0.4 /100 | #285 | Tragic 28.1% |
| Immigrants | Austria | 0.4 /100 | #286 | Tragic 28.1% |
| Okinawans | 0.4 /100 | #287 | Tragic 28.1% |
| Choctaw | 0.4 /100 | #288 | Tragic 28.1% |
| Canadians | 0.3 /100 | #289 | Tragic 28.1% |
| Australians | 0.3 /100 | #290 | Tragic 28.2% |
| Czechoslovakians | 0.3 /100 | #291 | Tragic 28.2% |
| Immigrants | Australia | 0.3 /100 | #292 | Tragic 28.2% |
| Immigrants | Israel | 0.3 /100 | #293 | Tragic 28.2% |