Celtic vs Immigrants from Scotland Wage/Income Gap
COMPARE
Celtic
Immigrants from Scotland
Wage/Income Gap
Wage/Income Gap Comparison
Celtics
Immigrants from Scotland
27.3%
WAGE/INCOME GAP
2.8/ 100
METRIC RATING
247th/ 347
METRIC RANK
28.7%
WAGE/INCOME GAP
0.1/ 100
METRIC RATING
314th/ 347
METRIC RANK
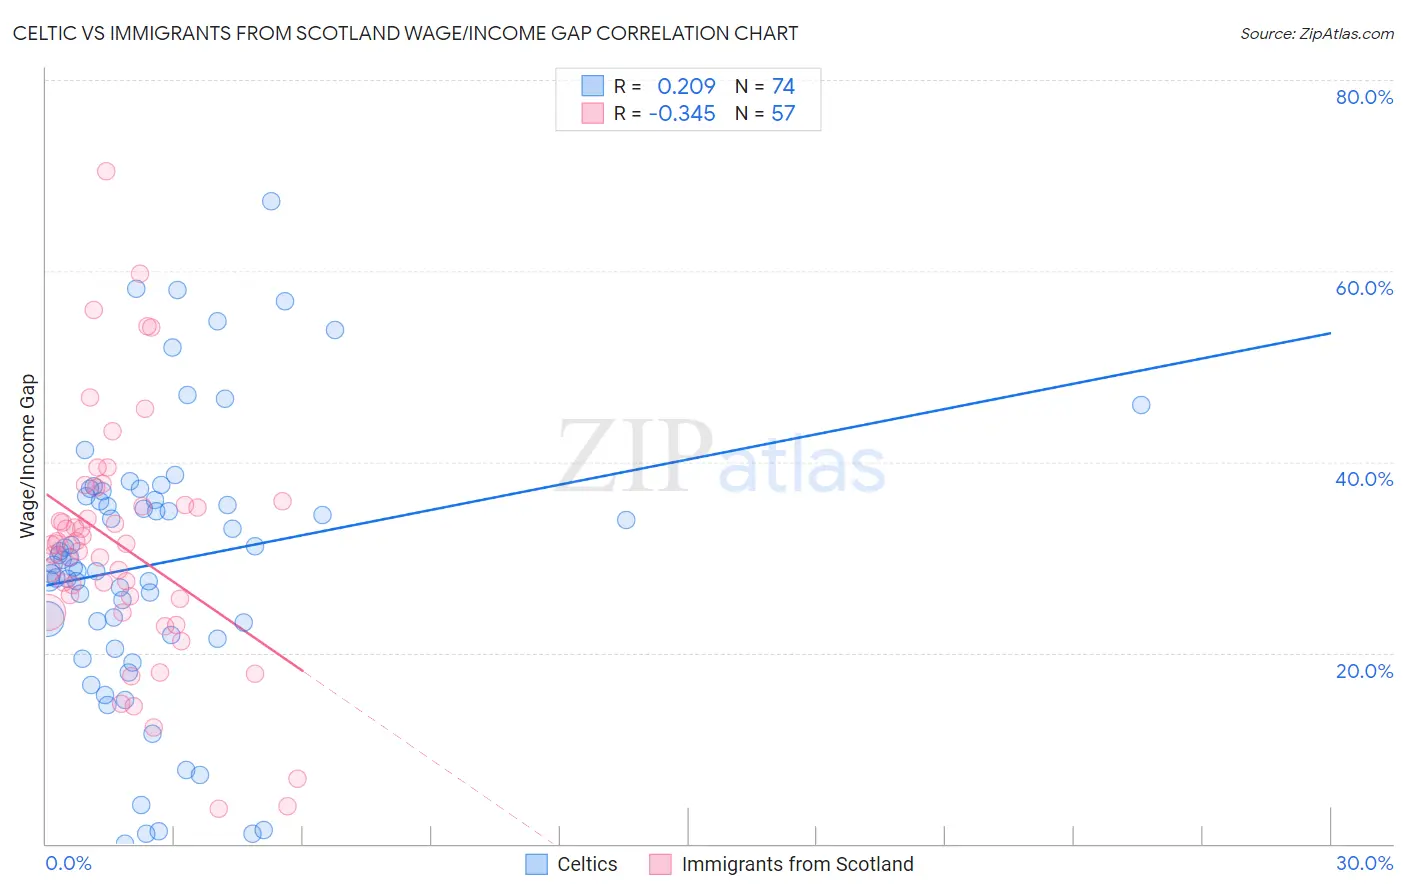
Celtic vs Immigrants from Scotland Wage/Income Gap Correlation Chart
The statistical analysis conducted on geographies consisting of 168,805,315 people shows a weak positive correlation between the proportion of Celtics and wage/income gap percentage in the United States with a correlation coefficient (R) of 0.209 and weighted average of 27.3%. Similarly, the statistical analysis conducted on geographies consisting of 196,317,574 people shows a mild negative correlation between the proportion of Immigrants from Scotland and wage/income gap percentage in the United States with a correlation coefficient (R) of -0.345 and weighted average of 28.7%, a difference of 5.4%.
Wage/Income Gap Correlation Summary
| Measurement | Celtic | Immigrants from Scotland |
| Minimum | 0.040% | 3.7% |
| Maximum | 67.3% | 70.5% |
| Range | 67.3% | 66.8% |
| Mean | 29.4% | 31.2% |
| Median | 29.5% | 31.4% |
| Interquartile 25% (IQ1) | 21.9% | 24.9% |
| Interquartile 75% (IQ3) | 36.4% | 35.7% |
| Interquartile Range (IQR) | 14.5% | 10.7% |
| Standard Deviation (Sample) | 14.3% | 12.7% |
| Standard Deviation (Population) | 14.2% | 12.6% |
Similar Demographics by Wage/Income Gap
Demographics Similar to Celtics by Wage/Income Gap
In terms of wage/income gap, the demographic groups most similar to Celtics are Cypriot (27.3%, a difference of 0.010%), Carpatho Rusyn (27.3%, a difference of 0.020%), Immigrants from Czechoslovakia (27.3%, a difference of 0.030%), Immigrants from Norway (27.3%, a difference of 0.14%), and Ukrainian (27.3%, a difference of 0.20%).
| Demographics | Rating | Rank | Wage/Income Gap |
| Immigrants | Europe | 3.8 /100 | #240 | Tragic 27.1% |
| Creek | 3.8 /100 | #241 | Tragic 27.1% |
| Immigrants | Sri Lanka | 3.7 /100 | #242 | Tragic 27.1% |
| Spanish | 3.6 /100 | #243 | Tragic 27.1% |
| Chickasaw | 3.5 /100 | #244 | Tragic 27.2% |
| Immigrants | Azores | 3.5 /100 | #245 | Tragic 27.2% |
| Immigrants | Nonimmigrants | 3.3 /100 | #246 | Tragic 27.2% |
| Celtics | 2.8 /100 | #247 | Tragic 27.3% |
| Cypriots | 2.8 /100 | #248 | Tragic 27.3% |
| Carpatho Rusyns | 2.7 /100 | #249 | Tragic 27.3% |
| Immigrants | Czechoslovakia | 2.7 /100 | #250 | Tragic 27.3% |
| Immigrants | Norway | 2.5 /100 | #251 | Tragic 27.3% |
| Ukrainians | 2.4 /100 | #252 | Tragic 27.3% |
| Portuguese | 2.2 /100 | #253 | Tragic 27.4% |
| Israelis | 2.1 /100 | #254 | Tragic 27.4% |
Demographics Similar to Immigrants from Scotland by Wage/Income Gap
In terms of wage/income gap, the demographic groups most similar to Immigrants from Scotland are Maltese (28.7%, a difference of 0.050%), Lithuanian (28.7%, a difference of 0.060%), French (28.7%, a difference of 0.15%), Belgian (28.8%, a difference of 0.17%), and Basque (28.8%, a difference of 0.22%).
| Demographics | Rating | Rank | Wage/Income Gap |
| Immigrants | Denmark | 0.1 /100 | #307 | Tragic 28.5% |
| Poles | 0.1 /100 | #308 | Tragic 28.5% |
| Macedonians | 0.1 /100 | #309 | Tragic 28.6% |
| Finns | 0.1 /100 | #310 | Tragic 28.6% |
| Immigrants | Lithuania | 0.1 /100 | #311 | Tragic 28.6% |
| Eastern Europeans | 0.1 /100 | #312 | Tragic 28.6% |
| French | 0.1 /100 | #313 | Tragic 28.7% |
| Immigrants | Scotland | 0.1 /100 | #314 | Tragic 28.7% |
| Maltese | 0.1 /100 | #315 | Tragic 28.7% |
| Lithuanians | 0.1 /100 | #316 | Tragic 28.7% |
| Belgians | 0.1 /100 | #317 | Tragic 28.8% |
| Basques | 0.1 /100 | #318 | Tragic 28.8% |
| Slovaks | 0.1 /100 | #319 | Tragic 28.9% |
| British | 0.1 /100 | #320 | Tragic 28.9% |
| Welsh | 0.1 /100 | #321 | Tragic 28.9% |