Swedish vs Immigrants from Austria Wage/Income Gap
COMPARE
Swedish
Immigrants from Austria
Wage/Income Gap
Wage/Income Gap Comparison
Swedes
Immigrants from Austria
29.4%
WAGE/INCOME GAP
0.0/ 100
METRIC RATING
334th/ 347
METRIC RANK
28.1%
WAGE/INCOME GAP
0.4/ 100
METRIC RATING
286th/ 347
METRIC RANK
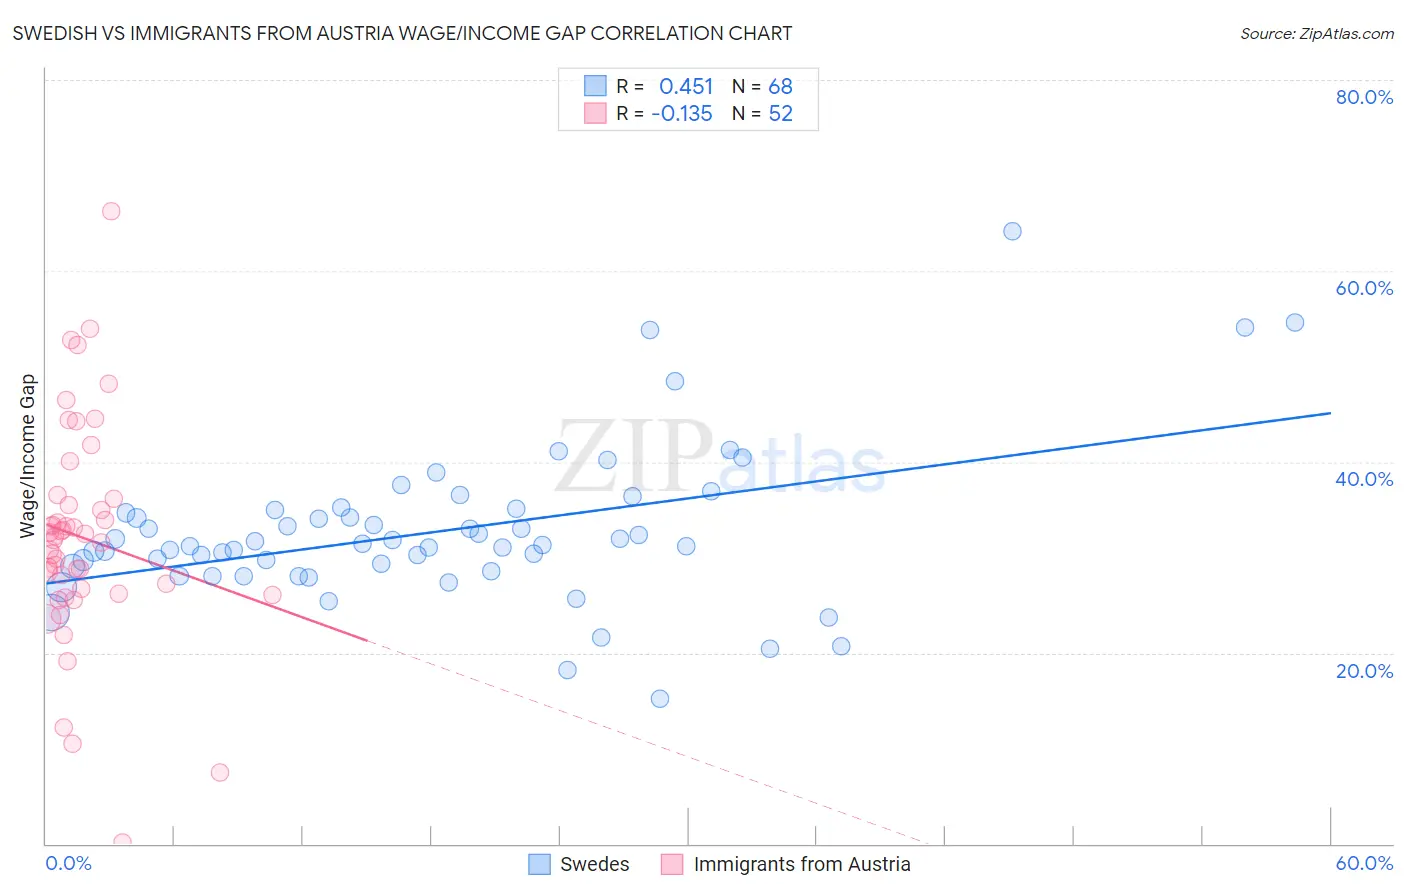
Swedish vs Immigrants from Austria Wage/Income Gap Correlation Chart
The statistical analysis conducted on geographies consisting of 537,447,925 people shows a moderate positive correlation between the proportion of Swedes and wage/income gap percentage in the United States with a correlation coefficient (R) of 0.451 and weighted average of 29.4%. Similarly, the statistical analysis conducted on geographies consisting of 167,902,173 people shows a poor negative correlation between the proportion of Immigrants from Austria and wage/income gap percentage in the United States with a correlation coefficient (R) of -0.135 and weighted average of 28.1%, a difference of 4.6%.
Wage/Income Gap Correlation Summary
| Measurement | Swedish | Immigrants from Austria |
| Minimum | 15.2% | 0.18% |
| Maximum | 64.2% | 66.3% |
| Range | 49.0% | 66.1% |
| Mean | 32.7% | 32.1% |
| Median | 31.2% | 32.1% |
| Interquartile 25% (IQ1) | 28.8% | 26.4% |
| Interquartile 75% (IQ3) | 34.8% | 35.9% |
| Interquartile Range (IQR) | 6.1% | 9.4% |
| Standard Deviation (Sample) | 8.2% | 11.6% |
| Standard Deviation (Population) | 8.1% | 11.5% |
Similar Demographics by Wage/Income Gap
Demographics Similar to Swedes by Wage/Income Gap
In terms of wage/income gap, the demographic groups most similar to Swedes are Immigrants from Taiwan (29.5%, a difference of 0.13%), European (29.4%, a difference of 0.14%), English (29.5%, a difference of 0.14%), Immigrants from South Central Asia (29.3%, a difference of 0.34%), and Dutch (29.6%, a difference of 0.72%).
| Demographics | Rating | Rank | Wage/Income Gap |
| Immigrants | Iran | 0.0 /100 | #327 | Tragic 29.1% |
| Scandinavians | 0.0 /100 | #328 | Tragic 29.1% |
| Scottish | 0.0 /100 | #329 | Tragic 29.1% |
| Germans | 0.0 /100 | #330 | Tragic 29.2% |
| Czechs | 0.0 /100 | #331 | Tragic 29.2% |
| Immigrants | South Central Asia | 0.0 /100 | #332 | Tragic 29.3% |
| Europeans | 0.0 /100 | #333 | Tragic 29.4% |
| Swedes | 0.0 /100 | #334 | Tragic 29.4% |
| Immigrants | Taiwan | 0.0 /100 | #335 | Tragic 29.5% |
| English | 0.0 /100 | #336 | Tragic 29.5% |
| Dutch | 0.0 /100 | #337 | Tragic 29.6% |
| Filipinos | 0.0 /100 | #338 | Tragic 29.7% |
| Iranians | 0.0 /100 | #339 | Tragic 29.7% |
| Swiss | 0.0 /100 | #340 | Tragic 30.0% |
| Thais | 0.0 /100 | #341 | Tragic 30.5% |
Demographics Similar to Immigrants from Austria by Wage/Income Gap
In terms of wage/income gap, the demographic groups most similar to Immigrants from Austria are Italian (28.1%, a difference of 0.030%), Okinawan (28.1%, a difference of 0.040%), Choctaw (28.1%, a difference of 0.070%), Canadian (28.1%, a difference of 0.11%), and Immigrants from Sweden (28.1%, a difference of 0.16%).
| Demographics | Rating | Rank | Wage/Income Gap |
| Romanians | 0.5 /100 | #279 | Tragic 28.0% |
| Russians | 0.5 /100 | #280 | Tragic 28.0% |
| Burmese | 0.5 /100 | #281 | Tragic 28.0% |
| South Africans | 0.5 /100 | #282 | Tragic 28.0% |
| French Canadians | 0.4 /100 | #283 | Tragic 28.1% |
| Immigrants | Sweden | 0.4 /100 | #284 | Tragic 28.1% |
| Italians | 0.4 /100 | #285 | Tragic 28.1% |
| Immigrants | Austria | 0.4 /100 | #286 | Tragic 28.1% |
| Okinawans | 0.4 /100 | #287 | Tragic 28.1% |
| Choctaw | 0.4 /100 | #288 | Tragic 28.1% |
| Canadians | 0.3 /100 | #289 | Tragic 28.1% |
| Australians | 0.3 /100 | #290 | Tragic 28.2% |
| Czechoslovakians | 0.3 /100 | #291 | Tragic 28.2% |
| Immigrants | Australia | 0.3 /100 | #292 | Tragic 28.2% |
| Immigrants | Israel | 0.3 /100 | #293 | Tragic 28.2% |